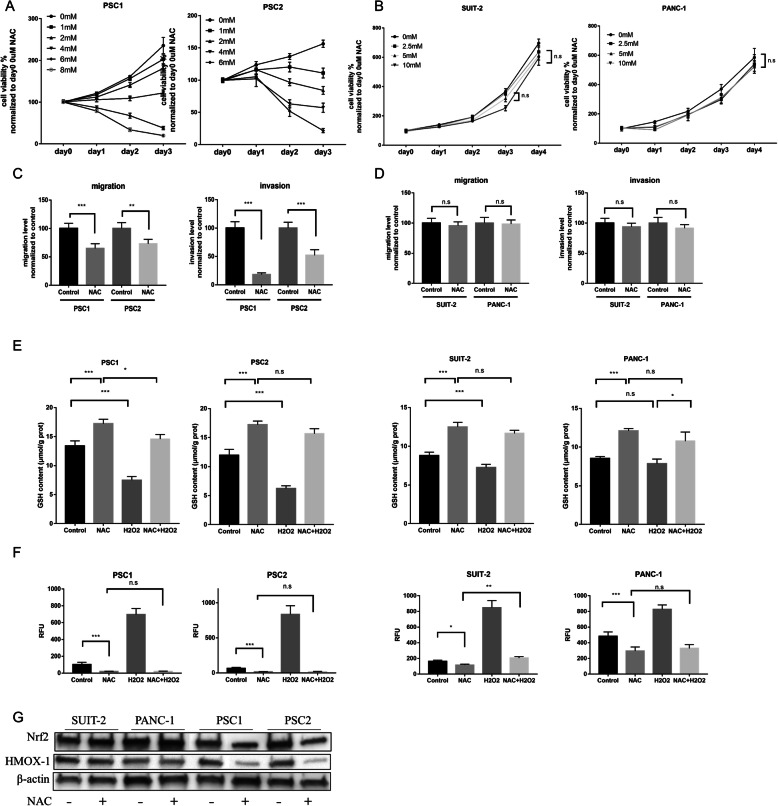
Fig. 1.
NAC inhibits the cell viability, migration, and invasion of PSCs rather than PCCs. a-b Cell viability assays of PSCs (PSC1 and PSC2) (a) and PCCs (SUIT-2 and PANC-1) (b) by various concentrations of NAC treatment were determined by a CellTiter-Glo luminescent cell viability assay. c–d Migration and invasion assays of PSCs. (c) and PCCs (d) after NAC treatment were analyzed. Migration and invasion values were normalized by the total cell numbers of each cell. For details, also see supplementary figure S2D-E. e Glutathione (GSH) level in PSC cells (left) which treated with 2.5 mM NAC with or without 10 μM H2O2, and in PCC cells (right) which treated with 5 mM NAC with or without 100 μM H2O2 for 24 h. Concentrations of H2O2 is different because of sensitivity to drug toxicity. f Intracellular reactive oxygen species (ROS) levels in PSCs and PCCs response to various treatment conditions. PSCs were treated with agents as follows: PBS (as control), 2.5 mM NAC, 20μM H2O2, or the combined 2.5 mM NAC with 20μM H2O2. PCCs were treated with components as follows: PBS (as control), 5 mM NAC, 200μM H2O2, or the combined 5 mM NAC with 200μM H2O2. At 30 min after treatment, intracellular ROS levels were measured in terms of relative fluorescence units (RFUs), the values of RFUs were normalized to the Control group in PSC1 cells. The values shown are means ± SEM from at least three independent experiments. Student’s t-tests (unpaired, unequal variance) were used for comparisons. g Expression of Nrf2 and HMOX-1 in PCCs and PSCs treated with or without NAC by western blotting.*P < 0.05; **P < 0.01; ***P < 0.001; n.s, no significance

