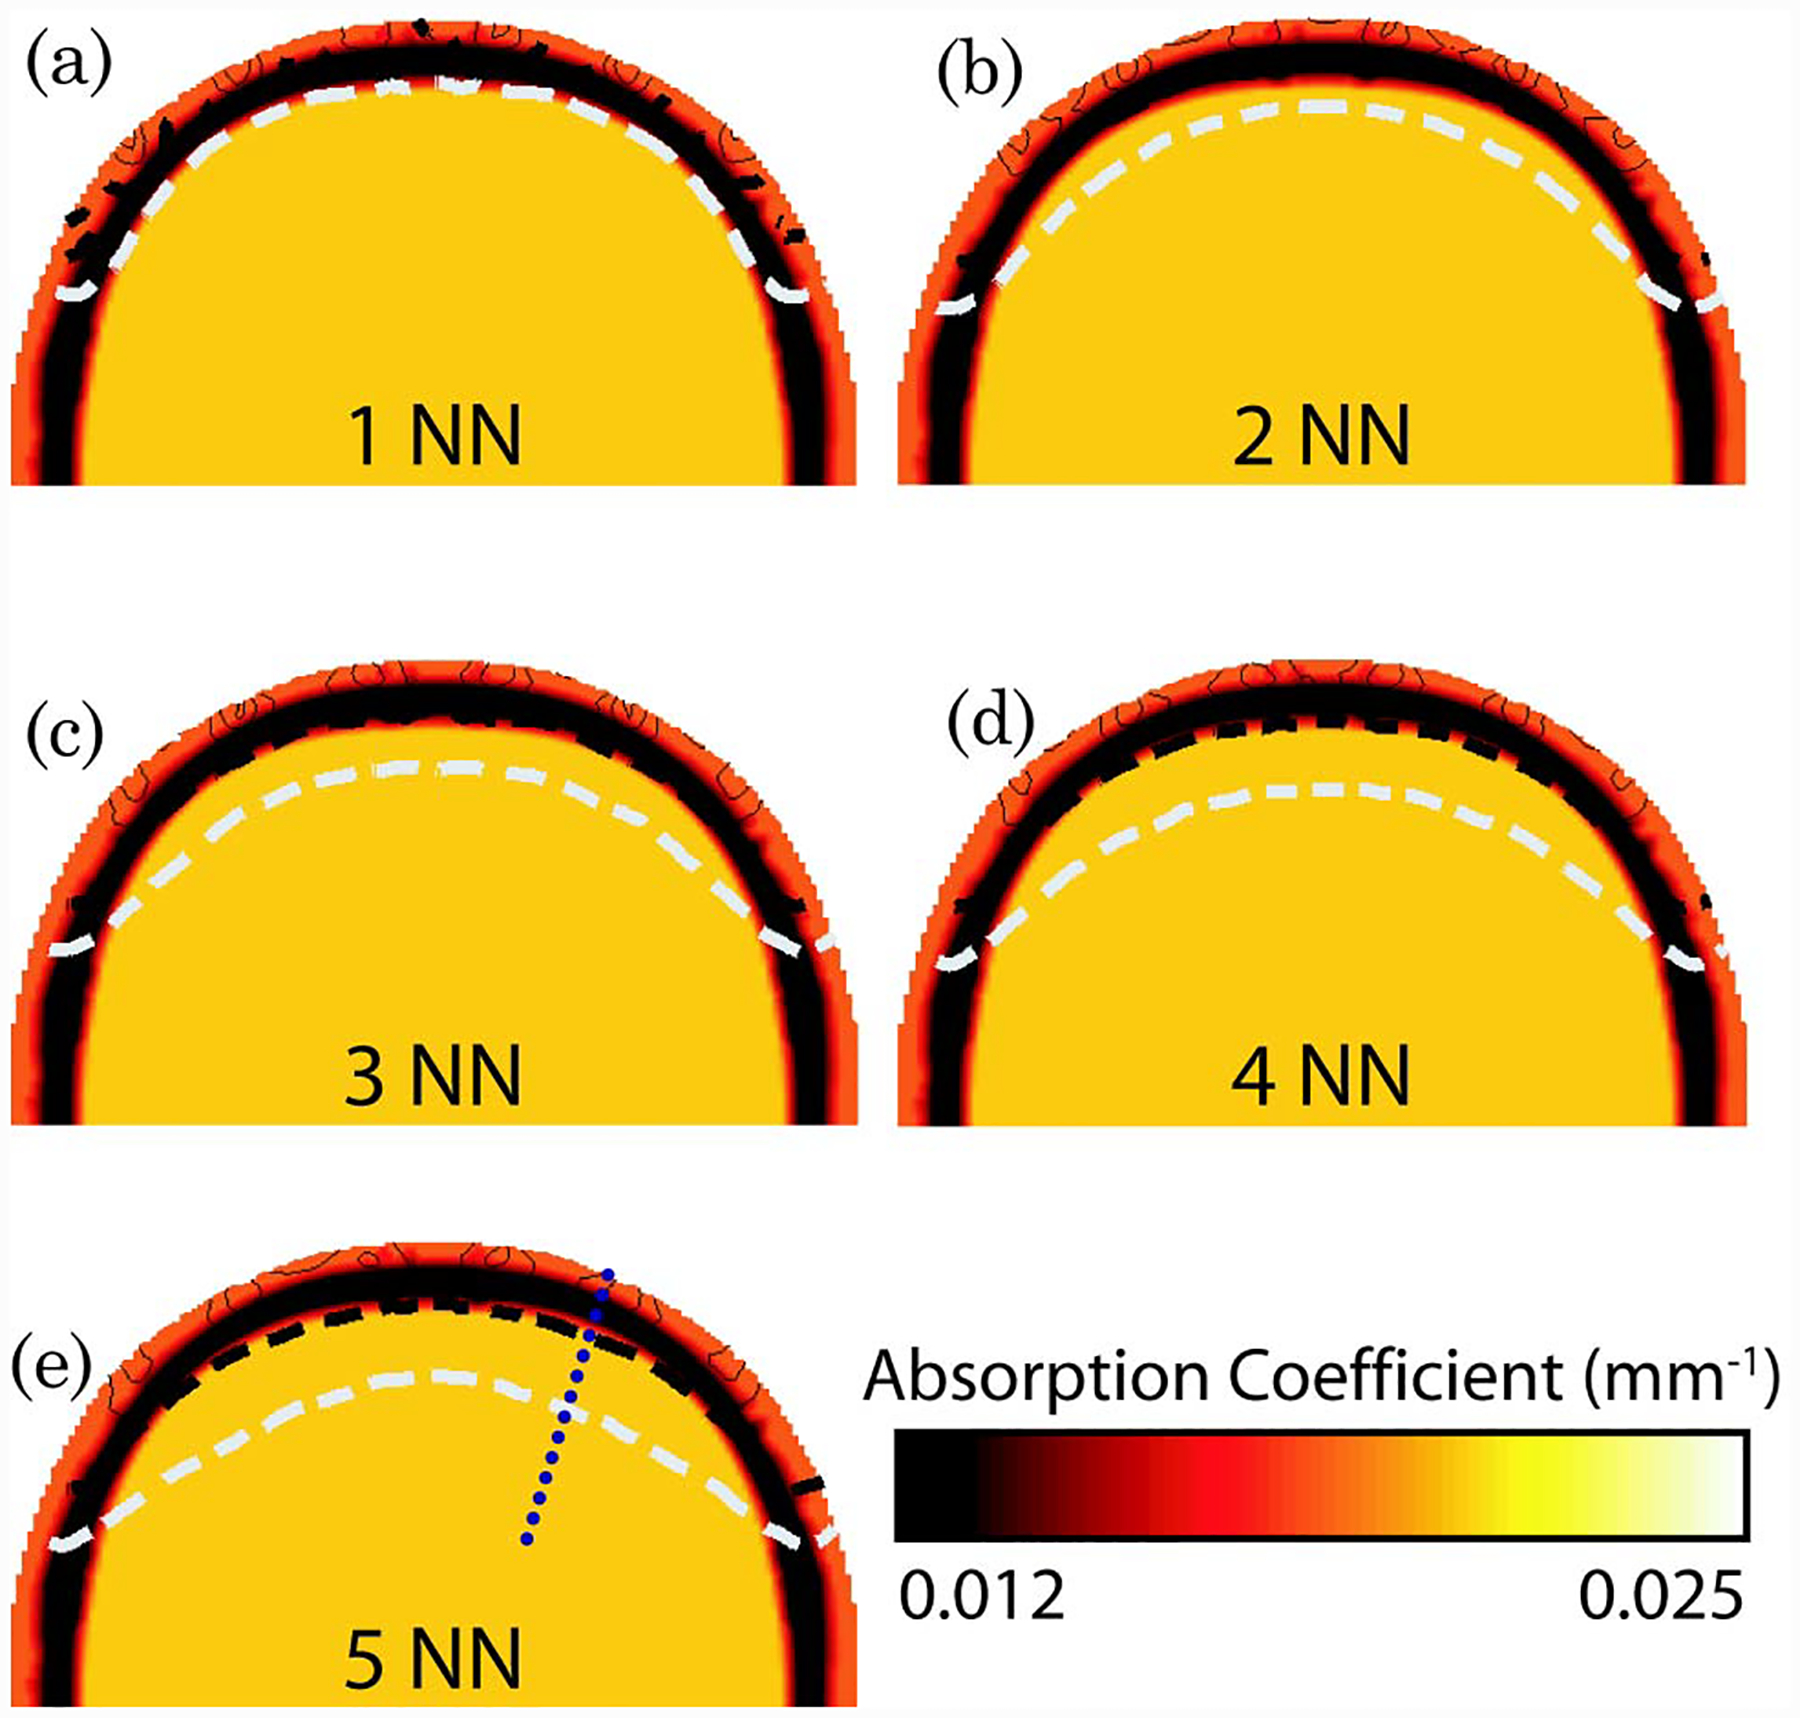
Fig. 4.

(Color online) Total normalized forward model sensitivity shown as contour lines on the back portion of the axial view of the 3D adult head model for each nearest neighbor (NN) set. The shades in each image represent the optical absorption properties at 849 nm, as shown in Fig. 2. Each contour line represents 10% of the total sensitivity with the dashed black line at 10% and dashed white line at 1% sensitivity.
