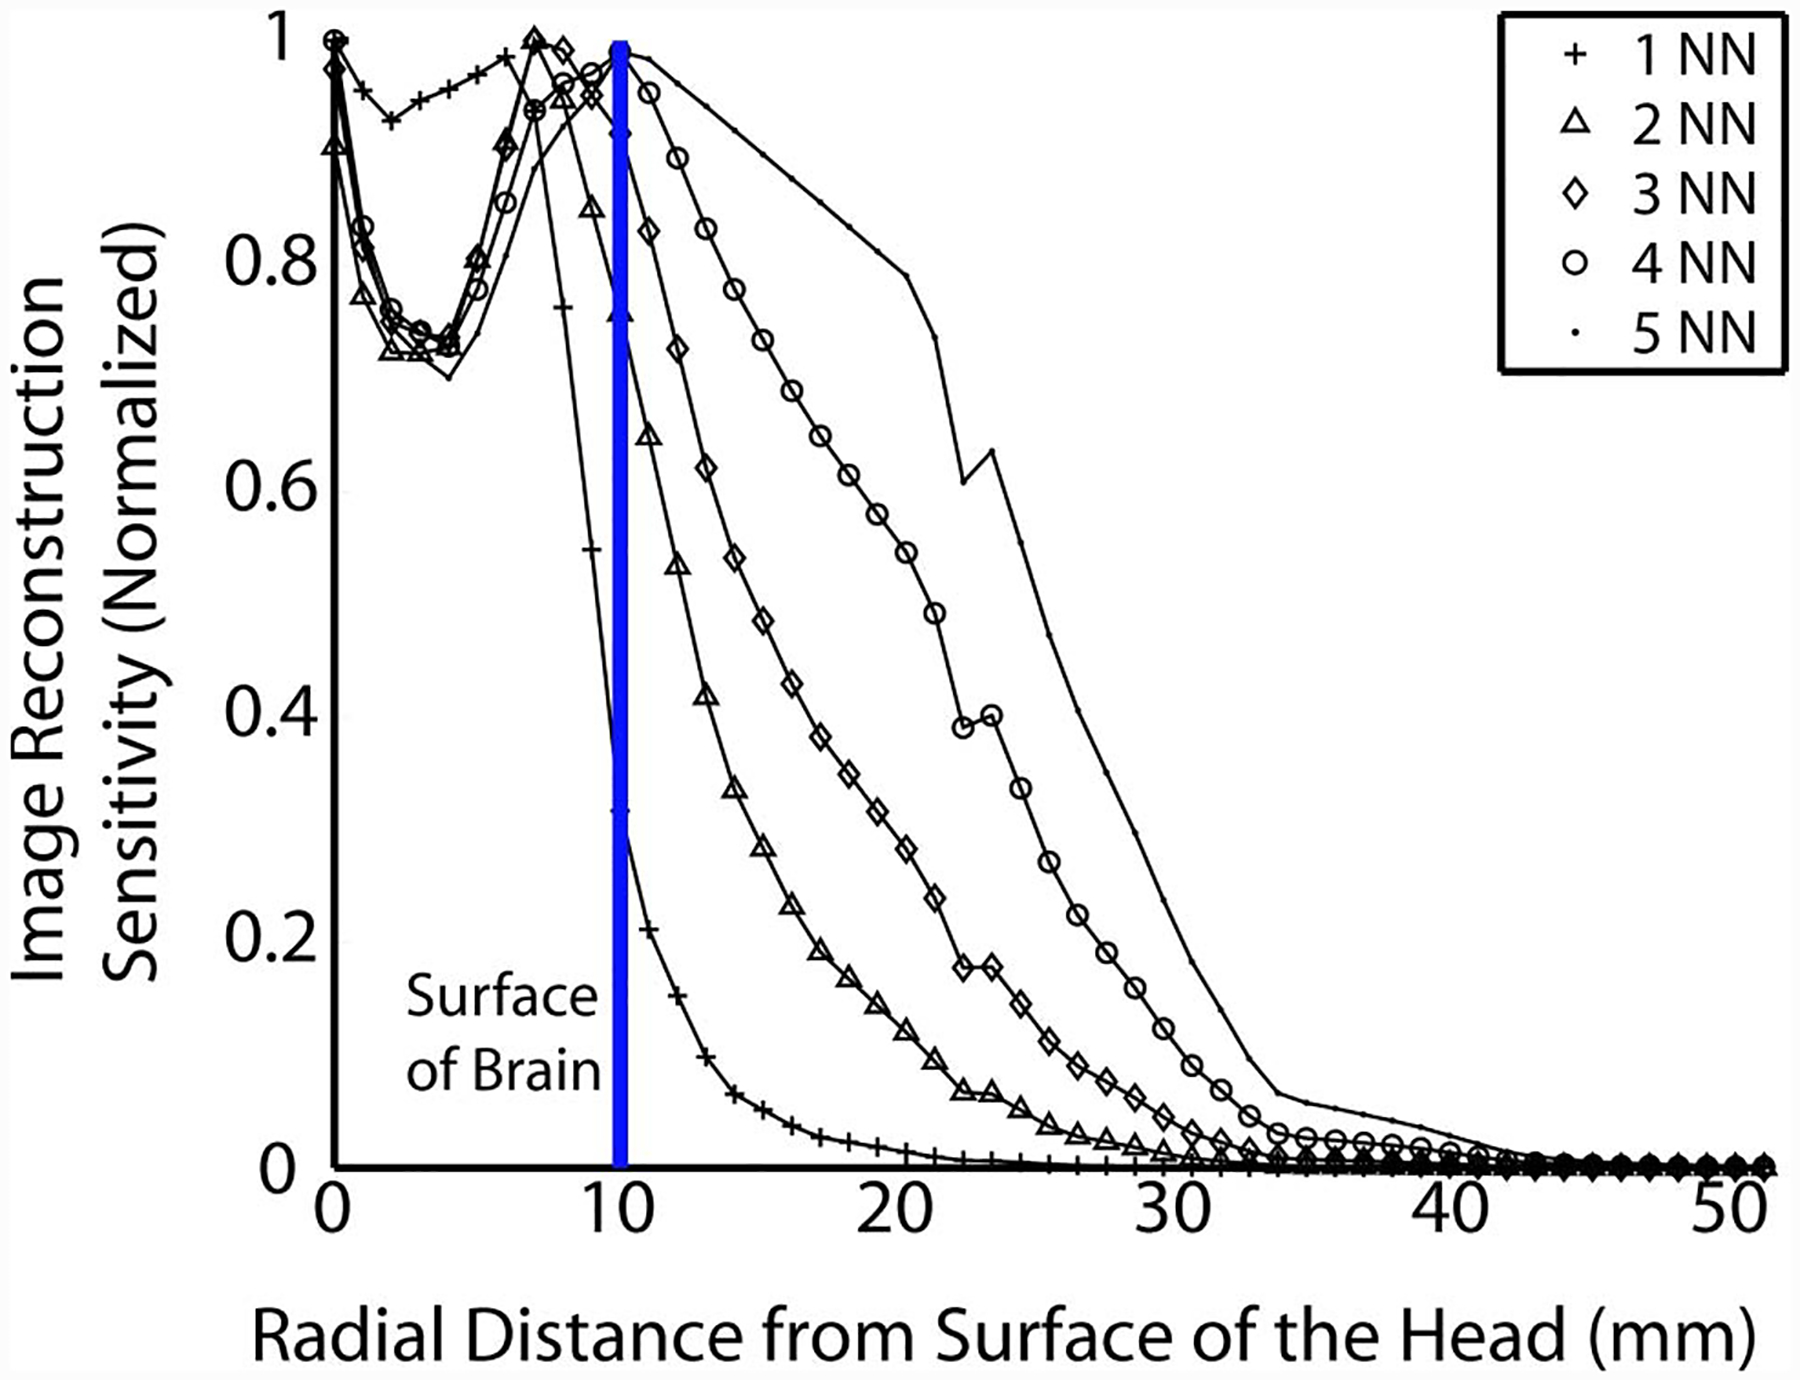
Fig. 5.

(Color online) Cross section (along the region depicted by the dashed line in Fig. 4(e)) of the flat-field image test for each nearest neighbor as a function of distance from surface of the head. The solid vertical line represents the surface of the brain.
