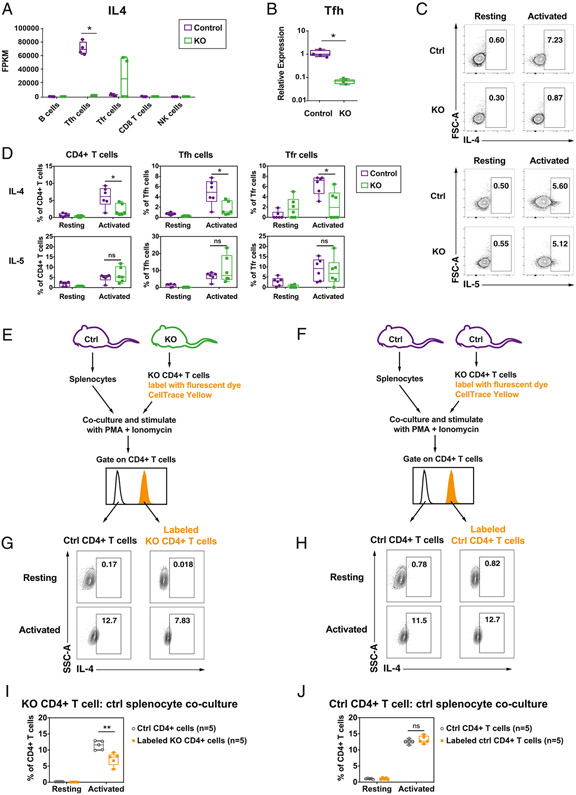
FIGURE 5. Rab11Fip5 expression is associated with IL-4 production in CD4+ T cells.
(A and B) IL-4 expression in different cell types from immunized RAB11FIP5−/− (KO) mice or control RAB11FIP5fl/fl (Control) mice shown as fragments per kb of transcript per million mapped reads (FPKM) (A) and relative expression in Tfh cells, as determined by qPCR analysis (*p < 0.05, as determined by Mann–Whitney U test) (B). (C and D) Effect of Rab11Fip5 deficiency on IL-4 and IL-5 production by mouse CD4+ T cells following stimulation. Mouse spleen cells were stimulated with PMA and ionomycin in the presence of the protein transport inhibitor monensin. Intracellular staining was performed after stimulation. Representative example of the IL-4 and IL-5 intracellular staining (C) and percentages of IL-4 and IL-5 positive subsets (D) were shown. Each dot indicates one animal, and the statistical significance of differences between groups was determined by Mann–Whitney U test. *p < 0.05. (E and F) Coculture of RAB11FIP5−/− (KO) CD4+ cells (E) or RAB11FIP5fl/fl control CD4+ cells (F) with littermate control splenocytes. CD4+ T cells were isolated from spleen cells of KO mice or control mice using magnetic beads, labeled with CellTrace Yellow dye, and mixed with control mice spleen cells. The KO CD4+ T cell–control splenocyte mixture (E), as well as the control CD4+ T cell–control splenocyte mixture (F), were cocultured, stimulated for either 4 h or overnight (two independent experiments), and analyzed for IL-4 production by intracellular staining. The results were similar in the two independent experiments. (G–J) IL-4 production in the stimulated KO CD4+ T cell–control splenocyte coculture or the stimulated control CD4+ T cell–control splenocyte coculture. Two independent experiments with five animals in each group were performed. Representative examples of the IL-4 intracellular staining (G and H) and percentages of IL-4 positive subsets (I and J) were compared between CellTrace Yellow–labeled and unlabeled CD4+ T cells. Each dot indicates one animal, and the statistical significance of differences between groups was determined by Mann–Whitney U test. **0.001 < p < 0.01. ns, not significant.

