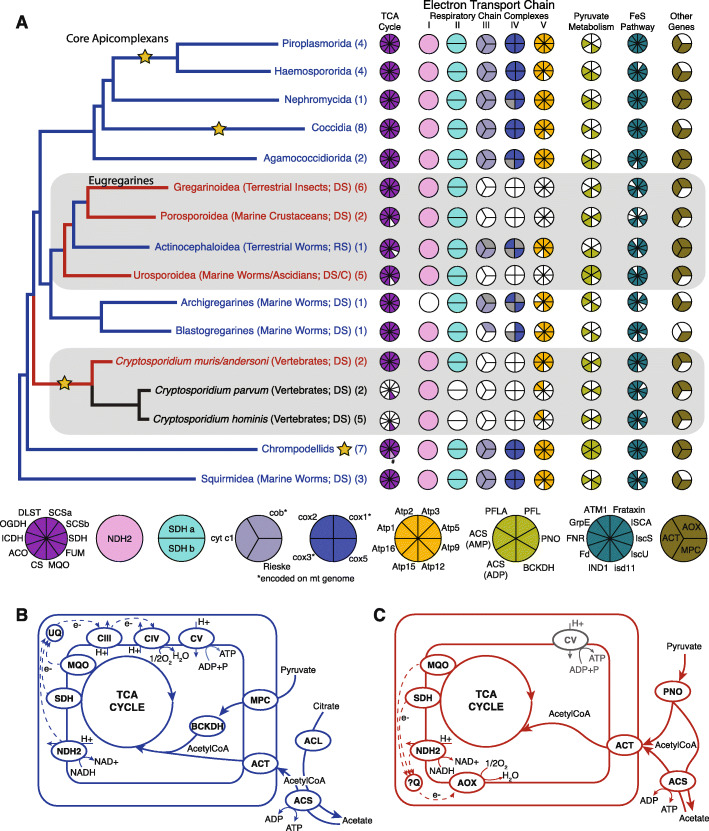
Fig. 2.
Evolution of apicomplexan mitochondrial metabolism. a Cartoon phylogeny of apicomplexans and their close relatives with Coulson plots representing the presence and absence of the tricarboxylic acid cycle (TCA), electron transport chain complexes (ETC), and other genes important for apicomplexan mitochondrial metabolism. The “#” symbol and lighter coloration for MQO in chrompodellids are to signify that they retain malate dehydrogenase rather than malate:quinone oxidoreductase for their TCA cycle. Genes encoded on the mitochondrial genome are indicated with an asterisk. If mitochondrion genome data are absent for a lineage, the corresponding piece of the Coulson plot is colored gray where the gene is presumed to exist due to retention of other genes in the associated complex. Branch names include taxonomy, host information, localization of parasites within the host (DS, digestive system; RS, reproductive system; C, coelom), and the number of genomes and transcriptomes included in each lineage. Gold stars on nodes indicate transitions to an intracellular lifestyle with the star next to the name for Chrompodellids representing an independent event within the clade giving rise to Piridium sociable. Branches on the phylogeny are colored according to in silico predictions for mitochondrial metabolism that are similarly colored and shown as b representing regular aerobic apicomplexan mitochondria which is depicted in blue and c representing an anaerobic mitochondrial metabolism. The functional role of the ETC complex V (ATP synthase) in Cryptosporidium muris and C. andersoni is shown in gray

