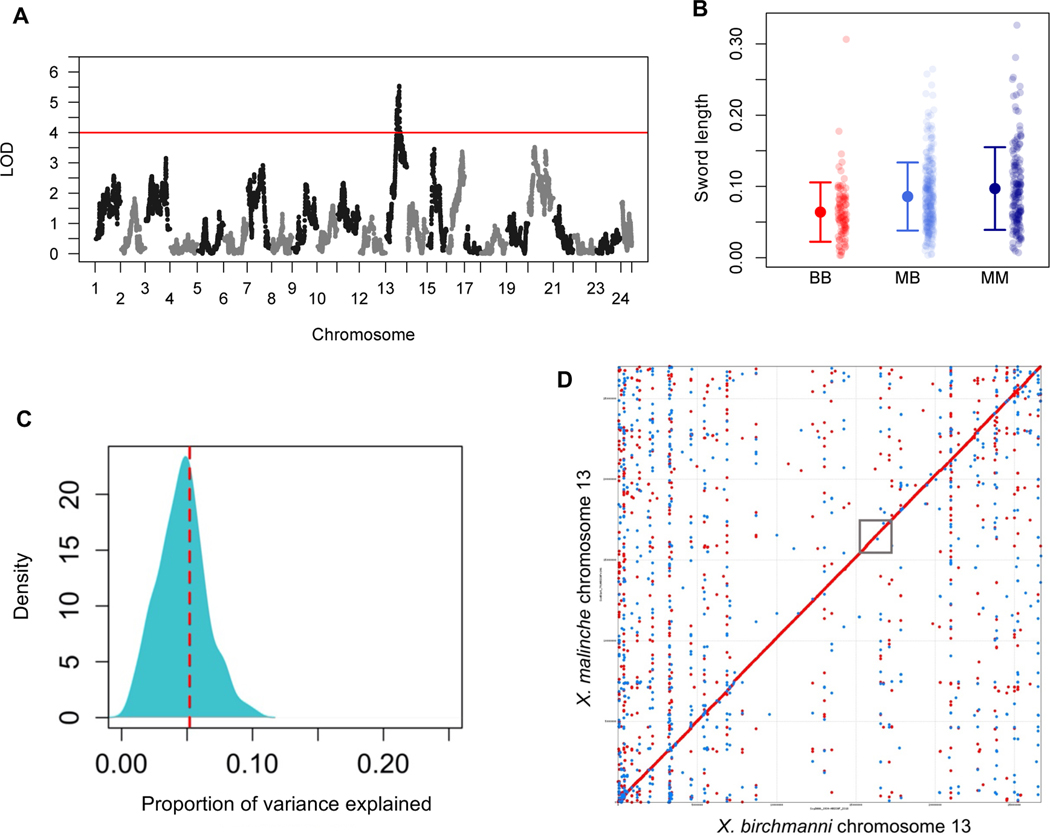
Figure 2. Chromosome 13 contains a major effect QTL that contributes to sword length.
A. Manhattan plot of QTL mapping results for sword length reveals a single genome-wide significant QTL (see also Figure S4). Red line indicates the genome-wide significant threshold determined by permutation; LOD – logarithm of odds. B. Sword length as a function of ancestry at the QTL peak. Small semi-transparent points show the raw data and large points and whiskers show the mean ± two standard errors of the mean. BB (red) - homozygous X. birchmanni, MB (light blue) - heterozygous, MM (dark blue) - homozygous X. malinche. C. Posterior distribution of ABC simulations to estimate the proportion of phenotypic variance explained by the sword length QTL on chromosome 13. The red line indicates the maximum a posteriori estimate of 0.055. This analysis indicates that the chromosome 13 QTL explains a substantial proportion of the heritable variation in sword length (~11%) but suggests the presence of other QTL underlying the sword (see Figure S3 for examination of heritability assumptions). D. MUMmer alignment of chromosome 13. This alignment, generated from the X. birchmanni and X. malinche de novo assemblies, indicates that there are no structural rearrangements between species in the QTL region. The approximate location of the QTL region is indicated by the gray box. Red dots indicate co-linear alignments, blue dots indicate inverted alignments.

