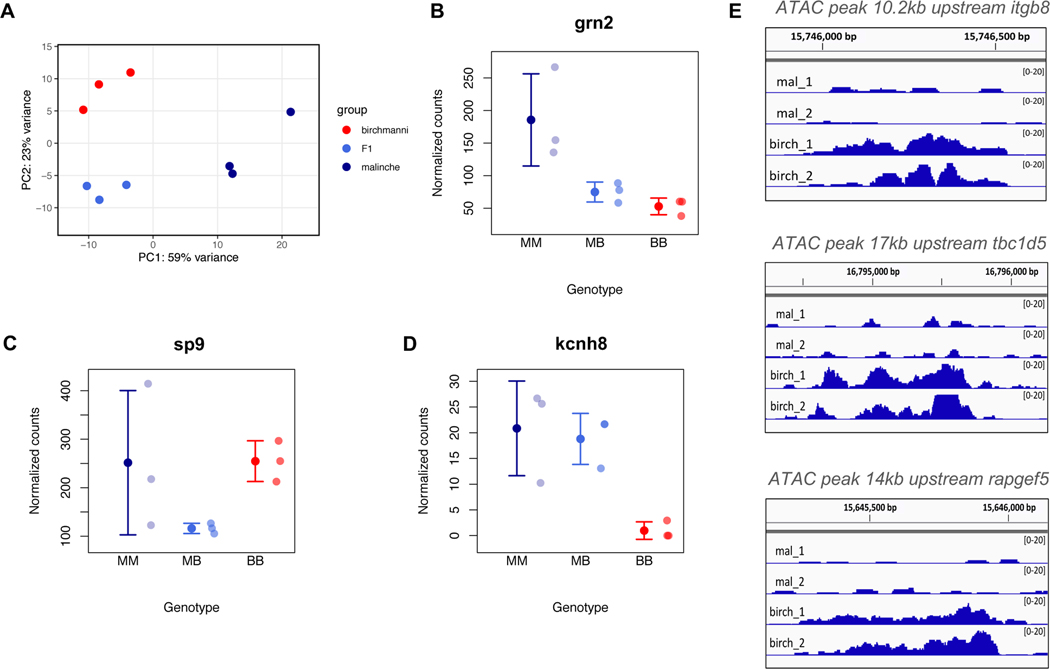
Figure 4. Expression data highlight candidate genes that may contribute to variation in sword length.
A. Principal component analysis of RNAseq data from regenerating caudal fin tissue, which will become sword tissue in X. malinche and F1s (see also Figure S5). B. Expression patterns of a candidate gene within the QTL region, grn2, that is differentially expressed between X. birchmanni and X. malinche in the regenerating sword and shows expression patterns consistent with predicted phenotypes. We note that grn2 is not differentially expressed between regenerating sword and regenerating non-sword caudal tissue (Figure S6A). BB - X. birchmanni, MB - F1 hybrids, MM - X. malinche. Small semi-transparent points show the raw data and solid points and whiskers show the mean ± one standard deviation. C. Expression patterns of sp9, a close functional partner of sp8, in regenerating caudal tissue. Semi-transparent points show normalized counts for each individual and solid points and whiskers show the mean ± one standard deviation. Expression in F1s is significantly lower than either X. birchmanni or X. malinche (p=0.008 and 0.006, respectively), suggestive of expression divergence between species in this pathway. D. Expression of kcnh8 in regenerating caudal tissue in X. malinche, X. birchmanni, and F1 hybrids. kcnh8 is a gene that falls outside of our QTL interval but was identified as a likely candidate in a companion manuscript by Schartl et al (34). Semi-transparent points show normalized counts for each individual and solid points and whiskers show the mean ± one standard deviation. The log fold change between X. birchmanni and X. malinche for kcnh8 estimated by DESeq2 was 3.54 (p< 1−4). E. ATAC-seq revealed that regenerating X. birchmanni fin tissue has significantly greater chromatin accessibility in several regions within the chromosome 13 QTL than X. malinche. The closest genes to each differential accessibility peak are noted above each plot. Peak images adapted from Integrative Genomics Viewer (39).

