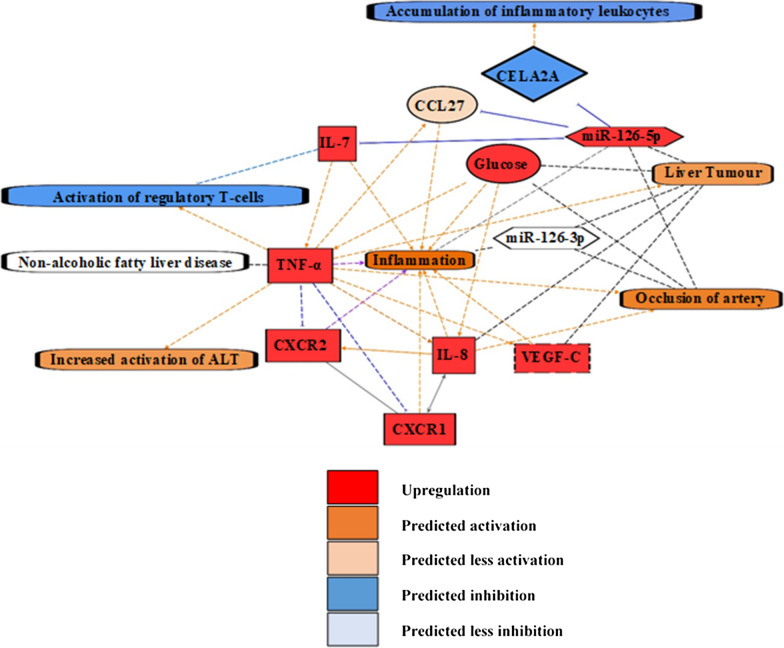
Fig. 4.
Ingenuity Pathway Analysis (IPA), prediction network of the T1DM conditions presented in this study with the upregulation (red) of miR-126-5p, IL-7, TNF-α, VEGF-C, CXCR1, CXCR2 and glucose. Orange signifies predicted activation of a molecule or biological function. Paler orange shades signify a prediction of less activation. Blue signifies inhibition of a molecule or biological function. White represents a molecule or biological function is unchanged. Orange lines represent stimulation, blues lines represent inhibition, the black lines represent a correlation, grey lines represent reciprocal stimulation and inhibition, and purple lines represents simultaneous stimulation and inhibition. Solid un-interrupted lines represent a direct action and dashed interrupted lines represent an indirect action. Alanine aminotransferase (ALT)

