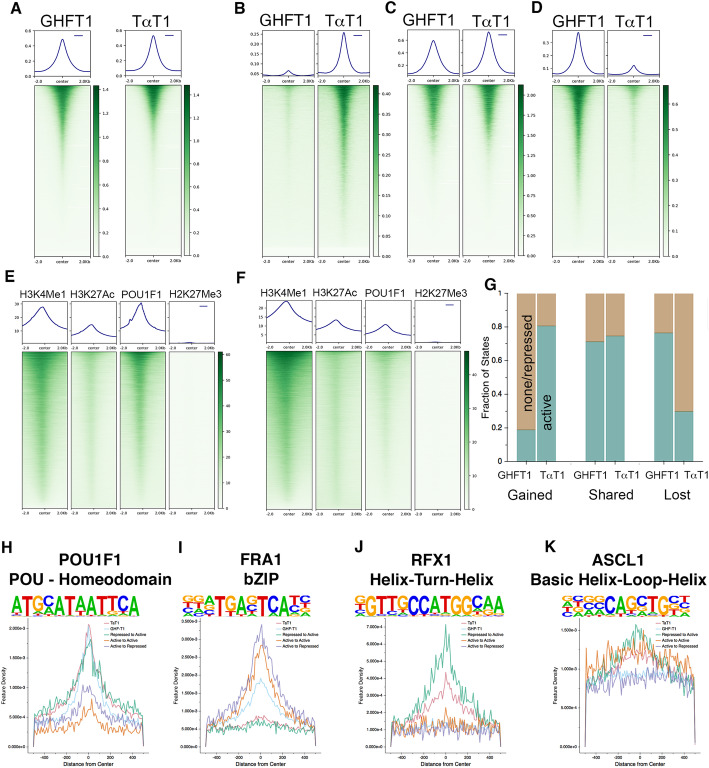
Fig. 4.
Comparison of open chromatin between GHF-T1 and TαT1 cells and prediction of transcription factor binding. a ATAC-seq signal at POU1F1 binding sites in GHFT1 and TαT1 cells. b ATAC-seq signal at POU1F1 binding sites that are specific to TαT1 cells. c ATAC-seq signal at POU1F1 binding sites that are shared between Tα T1 and GHF-T1 cells. d ATAC-seq signal at POU1F1 binding sites that are specific to GHF-T1 cells. e POU1F1 signal at enhancers in GHFT1 cells. f POU1F1 signal at enhancers in TαT1 cells. g The composition of active (teal) chromatin states vs repressed or unmarked chromatin states (brown) for POU1F1 binding sites in GHF-T1 and TαT1 cells is compared. Active states are defined as states 1–6 (Supplemental Figure 5). TαT1-specific sites (gained in differentiation, left) are mostly active in TαT1 cells, while shared sites (center) have equivalent active states. GHF-T1-specific sites (lost in differentiation, right) are mostly active in GHFT1 cells. h Density of POU1F1 motifs across POU1F1 binding sites in GHF-T1 cells (blue), TαT1 cells (red), at TαT1-specific POU1F1 binding sites that are repressed in GHF-T1 cells and active in TαT1 cells (repressed to active, green), POU1F1 binding sites that are shared in GHF-T1 and TαT1 cells that are active in both (active to active, orange), and POU1F1 binding sites that are specific to GHF-T1, and are in an active state in GHF-T1 cells and a repressed state in TαT1 cells (active to repressed, purple). i Similar analysis as h, for the bZIP transcription factor sites, like FRA1. j Similar analysis as h, for the HTH transcription factor sites, like RFX1. k Similar analysis as h, for bHLH transcription factor sites, like ASCL1. Supplemental Figure 6 shows more motifs

