Fig. 5.
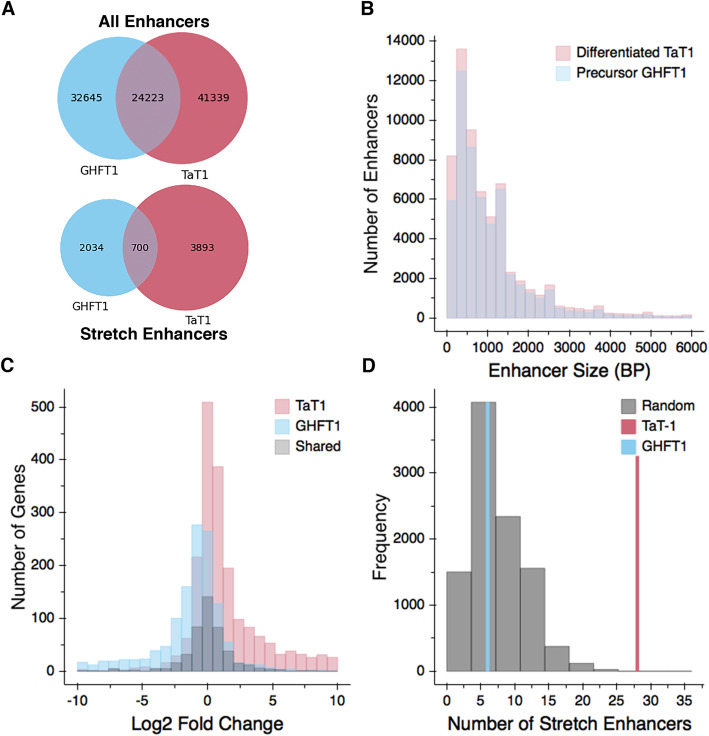
Comparison of putative enhancers in GHF-T1 and TαT1 cells. a A Venn diagram showing the number of shared and distinct enhancers in GHF-T1 and TαT1 cells (top). A Venn diagram showing the number of shared and distinct stretch enhancers in GHF-T1 and TαT1 cells (bottom). b A histogram showing the distribution of enhancer sizes in GHF-T1 (in blue) and TαT1 cells (in red). c A histogram showing the log 2-fold-change in expression of the genes that are closest to GHF-T1-specific stretch enhancers (blue), TαT1-specific stretch enhancers (red), and shared stretch enhancers (black). d Number of TαT1 (red) and GHF-T1 (blue) stretch enhancers within 100 kb (50 kb upstream or downstream) of the TSS of 25 genes important for thyrotrope function (Supplemental Table 3). To evaluate the significance of the difference, 25 genes were randomly selected, normalized for gene expression, and assessed for stretch enhancers. This process was repeated in 10,000 iterations and displayed as a histogram (gray)

