
Figure 2.
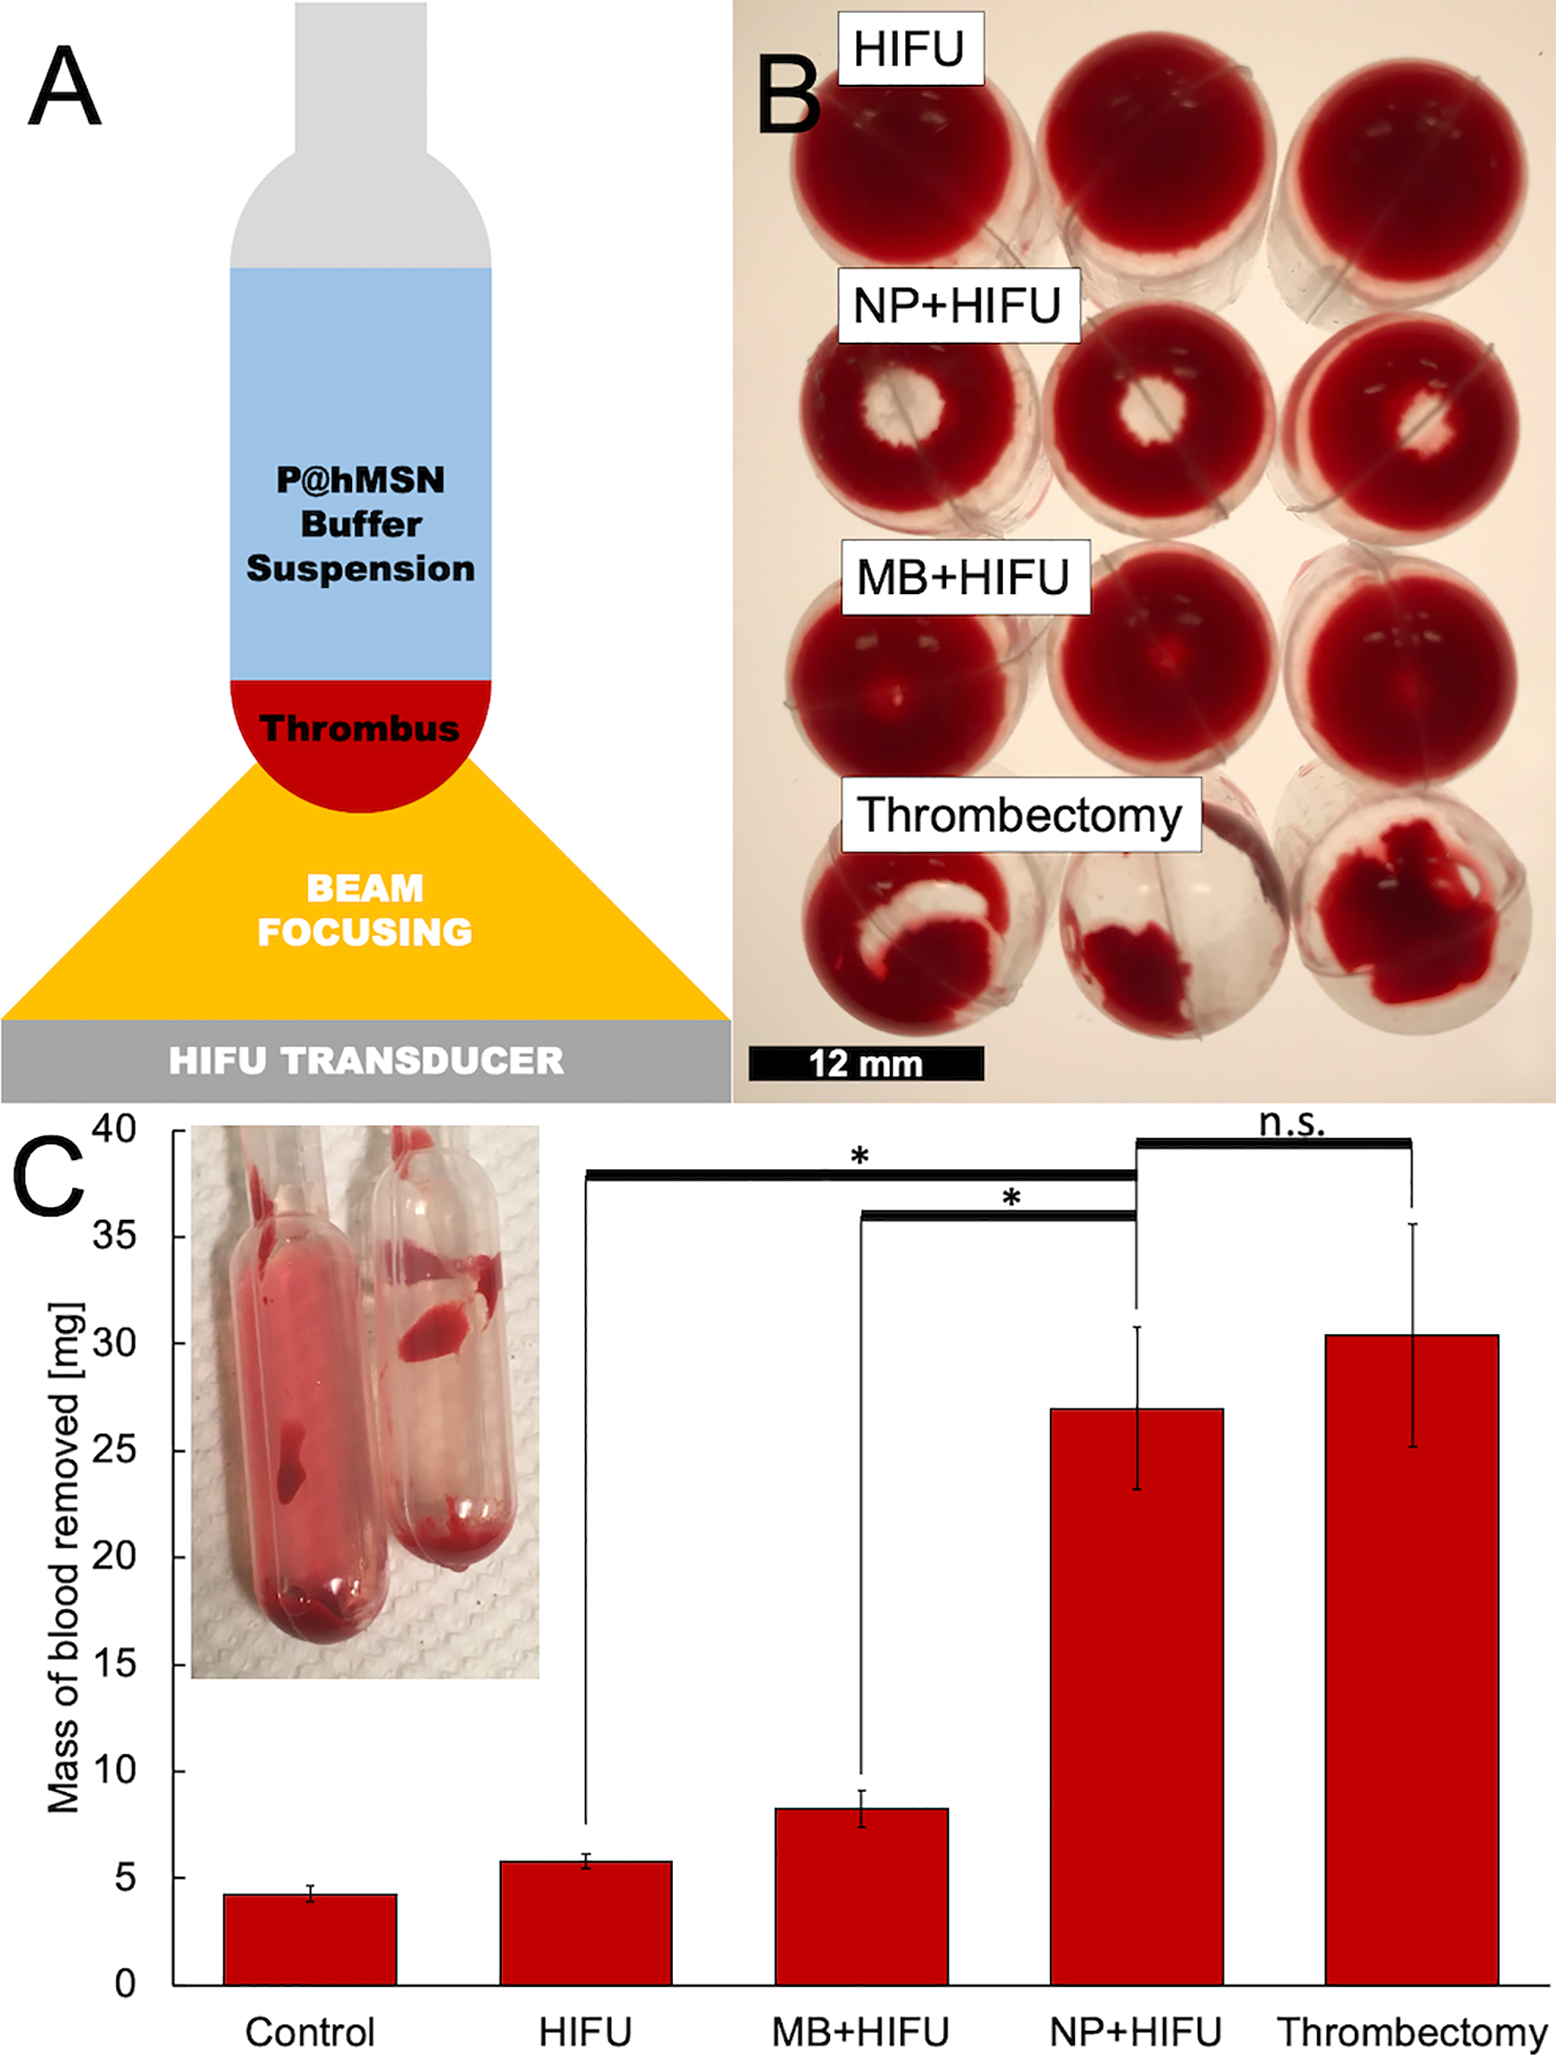
A) Schematic of the experimental setup of simulated thrombus exposed to high intensity focused ultrasound (HIFU). B) Photographs of clots treated by (top to bottom): HIFU only, P@hMSNs+HIFU, Microbubbles+HIFU, and mechanical thrombectomy model. Scale bar = 12 mm. C) Mass of blood removed from a 100 μL thrombus as determined by hemoglobin absorbance at 540 nm for four independent samples at each condition. Error bars denote one standard deviation. Inset: photograph showing (left) a HIFU+NP treated blood clot with the supernatant reddened by the disrupted thrombus, and (right) a HIFU-only control with minimal ejection of clot matter into the buffer solution. *Indicates significant difference at α=0.05, one-sided; n.s. denotes non-significance.