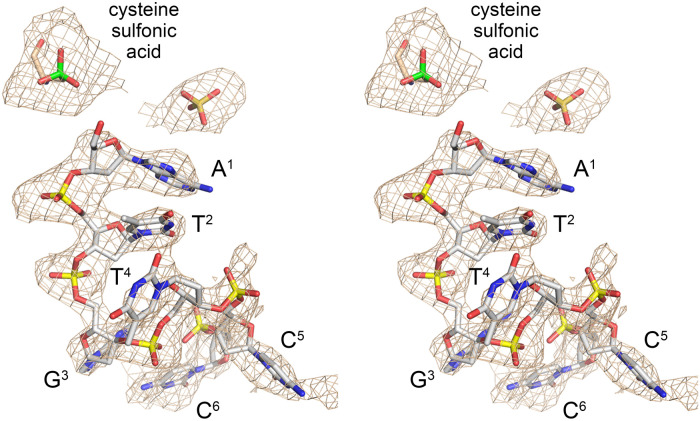
FIGURE 1.
RtcB active site occupancy by 5′-OH oligonucleotide. Stereo view of a simulated annealing difference density omit map of the RtcB active site (beige mesh), contoured at 2 σ with a carve radius of 3.6 Å. Strong electron density surrounding the Cys98 sulfur atom (shown in green) was modeled as cysteine sulfonic acid. A 6-mer DNA oligonucleotide, depicted as a stick model with gray carbons, was placed into density as shown. The nucleobases are labeled and numbered starting from the 5′-OH end. A sulfate anion (stick model) was also placed into density.

