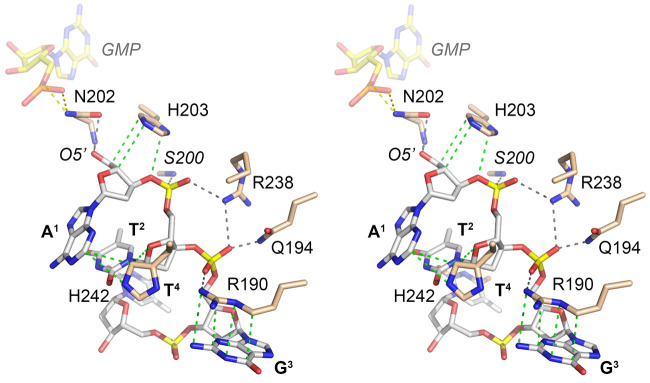
FIGURE 4.
RtcB interface with the 5′-OH strand. Stereo view of the active site highlighting atomic interactions with the 5′-OH DNA oligonucleotide. Hydrogen bonds are indicated by black dashed lines; van der Waals contacts by green dashed lines. The guanylate nucleotide from PhoRtcB structure 4IT0 is superimposed and depicted as a semitransparent stick model with yellow carbons. Putative hydrogen bonds from Asn202 to the guanylate are shown as yellow dashed lines.

