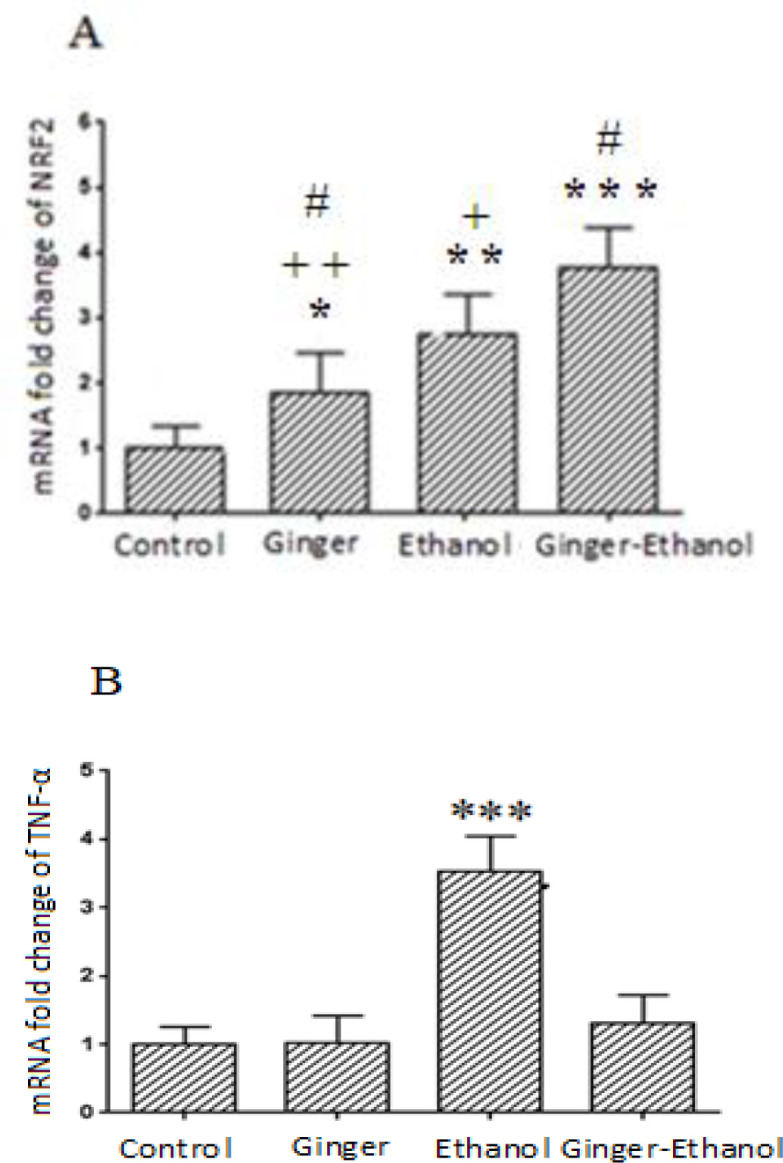
Figure 2.
Comparison of the expression of NRF2 (A) and TNFα (B) among control and treated groups (n=6). Data are expressed as mean±SEM

A. *p<0.05, **p<0.01 and ***p<0.001 significant difference compared to the control group. +p<0.05, ++p<0.01: significant difference compared to the Ginger-Ethanol group. #p<0.05: significant difference compared to the ethanol group.
B. ***p<0.001 vs.other groups.
