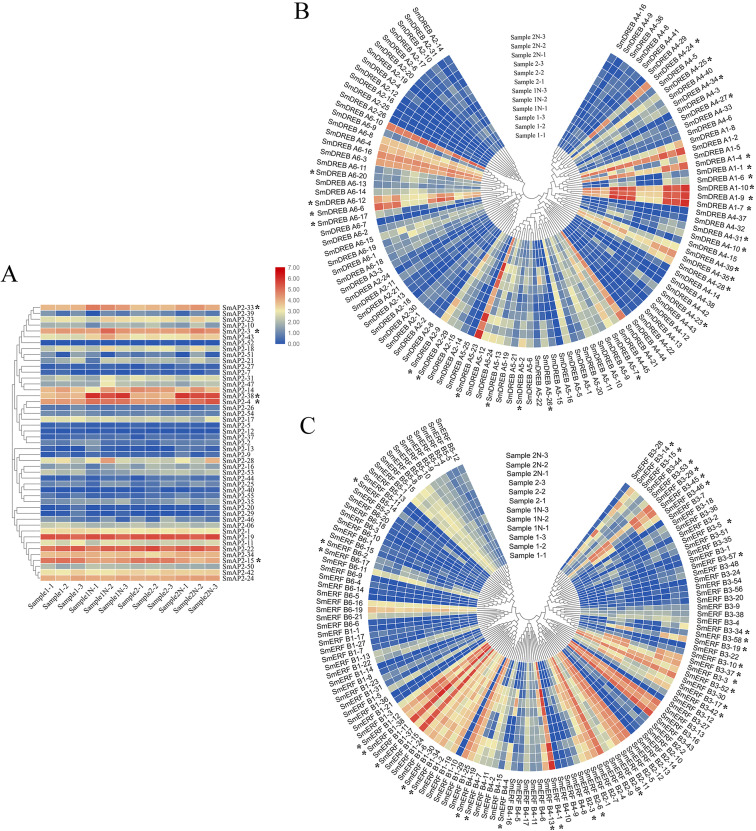
Figure 7. Hierarchical clustering of AP2 genes and heatmap that demonstrates the differential expression patterns of SmAP2/ERF genes in roots before and after salt stress.
The Log_10-transformed expression values of the FPKM values of 12 samples were used to draw the heatmap. The color bar indicates the gene expression level. (A) Heatmap and hierarchical clustering representation of 47 AP2 members. (B) Heatmap and hierarchical clustering representation of 108 DREB members. (C) Heatmap and hierarchical clustering representation of 130 ERF members. Sample1-1/Sample1-2/Sample1-3 means three replicated experiments of YJ CK, the ‘Yanjiang’ roots treated with water; Sample1N-1/Sample1N-2/Sample1N-3 means three replicated experiments of YJ NT, the ‘Yanjiang’ roots treated with 150 mM NaCl; Sample2-1/Sample2-2/Sample2-3 means three replicated experiments of 9901 CK, ‘9901’ roots treated with water; and Sample2N-1/Sample2N-2/Sample2N-3, means three replicated experiments of 9901 NT, ‘9901’ roots treated with 150 mM NaCl. The asterisks idictate the DEGs.

