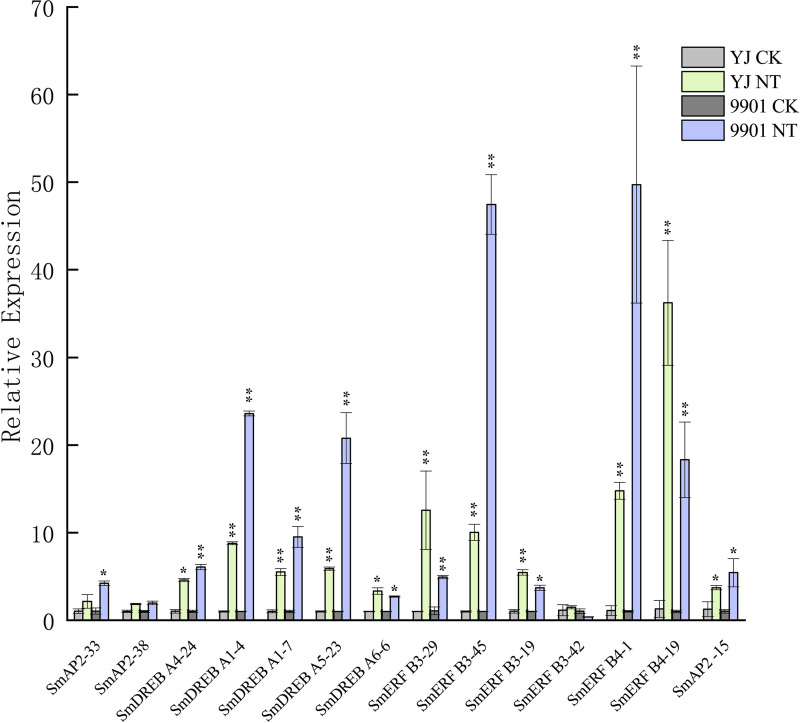
Figure 8. Verification of the SmAP2/ERF genes with differentially expressed patterns under salt stress by quantitative real-time PCR.
For salt stress, ‘Yanjiang’ and ‘9901’ roots that were subjected to 20 days of hydroponic culture and then treated with 150 mM sodium chloride for 4 h. The control was an untreated Yanjiang sample. Three biological replicates for each sample were performed, and bars represent the standard deviations of the mean. Asterisks on top of the bars indicate statistically significant differences between stress treatment and the control (*0.01 < P < 0.05; ** p < 0.01, Student’s t-test). Gene expression profiles were evaluated using the 2−ΔΔCt method, and the control value was normalized to 1.

