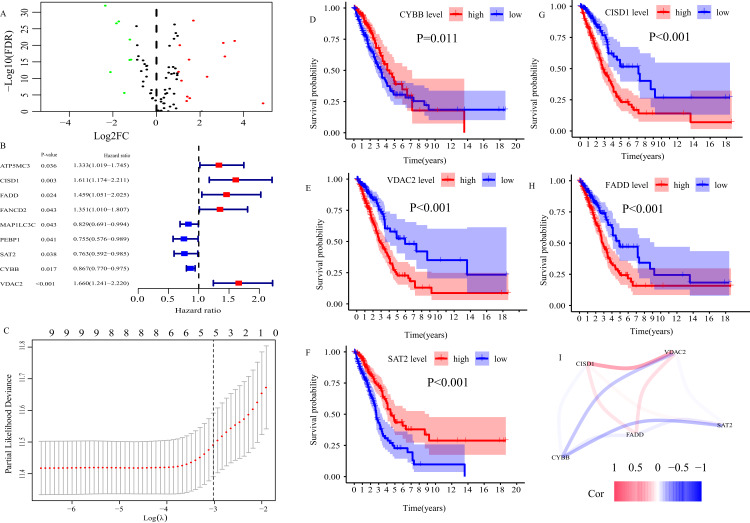
Figure 2. Construction of ferroptosis-related gene signature (FRGS) in TCGA cohort.
(A) Volcano plot of ferroptosis-related DEGs between normal and LUAD tissues with |log2FC| > 1 and FDR < 0.01. Red dots represent 13 up-regulated genes and green dots represent eight down-regulated genes. (B) Univariate Cox regression analysis identified nine ferroptosis-related genes were related to overall survival (P < 0.05). (C) “Leave- one-out-cross-validation” for parameter selection in LASSO regression to filter out five candidate genes. (D) Survival analysis of CYBB, (E) CISD1, (F) VDAC2, (G) FADD, (H) SAT2. (I) The correlation network of five candidate genes. DEG, differentially expressed genes; FDR, false discovery rate.

