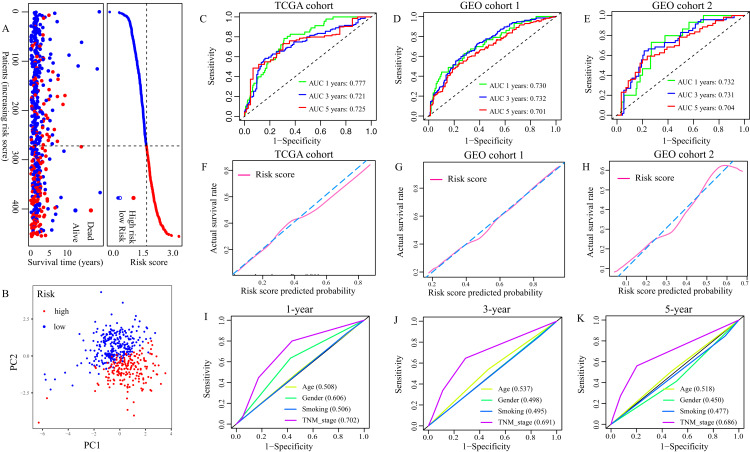
Figure 3. Evaluation of the FRGS.
(A) The distribution of risk score and survival status in TCGA cohort. (B) PCA showed that the patients in different risk groups were gathered in two areas. (C–E) The ROC of the FRGS for predicting 1-, 3- and 5-year OS in TCGA cohort, GEO cohort 1, and GEO cohort 2. (F–H) The calibration plots of TCGA cohort, GEO cohort 1 and GEO cohort 2. (I–K) The ROC of clinical indexes for predicting 1-, 3- and 5-year OS in TCGA cohort. PCA, principal component analysis; ROC, the receiver operating characteristic curve.

