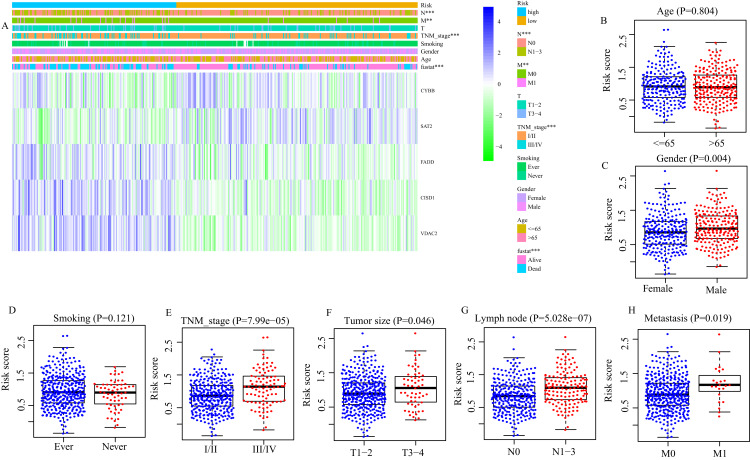
Figure 4. Correlation between risk score and clinical characteristics.
(A) The distribution of clinicopathological features between high- and low- risk group. (B) The difference of risk score between Age ≤ 65 and Age > 65, (C) between different gender, (D) smoking and non-smoking, (E) TNM stage I/II and III/IV, (F) T1/2 and T3/4, (G) between with and without lymph node metastasis, (H) between with and without distance metastasis. **P < 0.01, ***P < 0.001.

