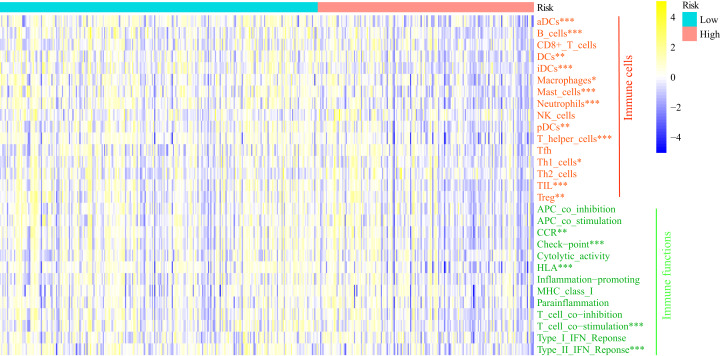
Figure 8. Comparison of the enrichment score of ssGSEA between different risk groups.
aDCs, activated dendritic cells; DCs, dendritic cells; iDCs, immature dendritic cells; pDCs, plasmacytoid dendritic cells; Tfh, T follicular helper cells; Th1_cells, type 1 helper cells; Th2_cells, type 2 helper cells; TIL, tumor infiltrating lymphocytes; Treg, regulatory T cells; HLA, human leukocyte antigen; CCR: C–C chemokine receptor; APC, antigen presenting cells; MHC, major histocompatibility complex. *P < 0.05, **P < 0.01, ***P < 0.001.

