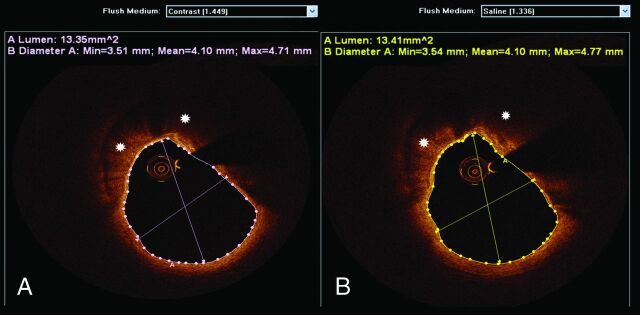
Fig 1.
FD-OCT quantitative assessments with contrast and saline injections. An FD-OCT cross-sectional image of the ICA obtained after undiluted iodinated contrast injection is depicted in (A). Luminal measurements and calcified plaque (asterisks) are demonstrated. The same artery (coregistered) was imaged by FD-OCT after heparinized saline injection (B), illustrating comparable luminal dimensions and plaque morphologic patterns. Note that the dedicated software used for analysis enables the selection of different flush media to account for different index of refraction.

