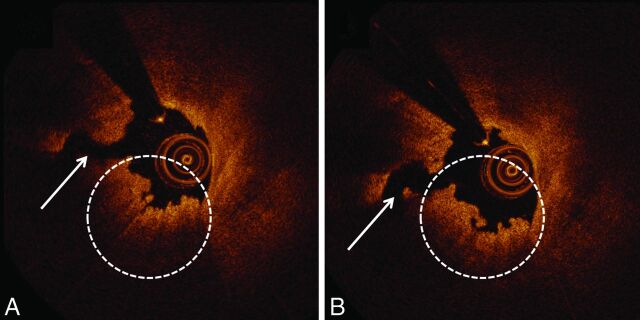
Fig 2.
FD-OCT qualitative assessments with contrast and saline injections. FD-OCT cross-section of the ICA was obtained with contrast injection (A). A ruptured plaque (white arrow) with overlying red thrombus (white dashed circle) is depicted. The same artery imaged by FD-OCT after saline injection (B) demonstrates similar features.

