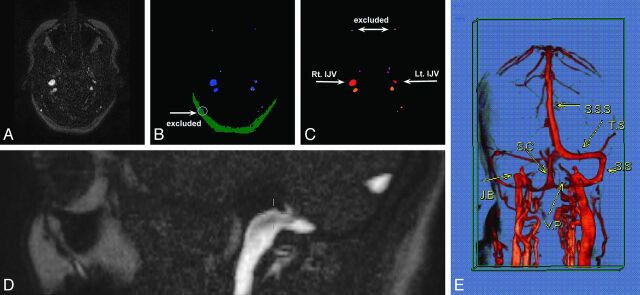
Fig 1.
Example of vein detection and mapping algorithms in 1 participant. The original phase-contrast MR image at the level of the JF (A) was initially processed by the vein detection algorithm according to intensity levels (B). Blue represents pixels that surpassed a high-intensity threshold. Yellow stands for pixels between medium and high-intensity thresholds attached to high-intensity objects. The vein cross-sectional area was determined by the sum of both blue and yellow areas. Green corresponds to low-intensity subcutaneous fat tissue. Detected veins in this tissue drain the scalp and therefore were excluded (white arrow). The resulting image was further processed by the mapping algorithm according to size and location (C). The 2 most anterior veins were identified as facial veins and thus were excluded. Vessels anterior to the jugular veins (red) were considered to be the pterygopalatine plexus (purple). Vessels posterior to the jugular veins were regarded as the vertebral plexus (orange). The level of image acquisition (JF) is also presented (D). E, Illustrative contrast-enhanced MR venography with 3D reconstruction demonstrates venous drainage of the brain: S.S.S., superior sagittal sinus; T.S., transverse sinus; S.S., sigmoid sinus; S.C., sinus cerebella; J.B., jugular bulb; V.P., vertebral plexus.

