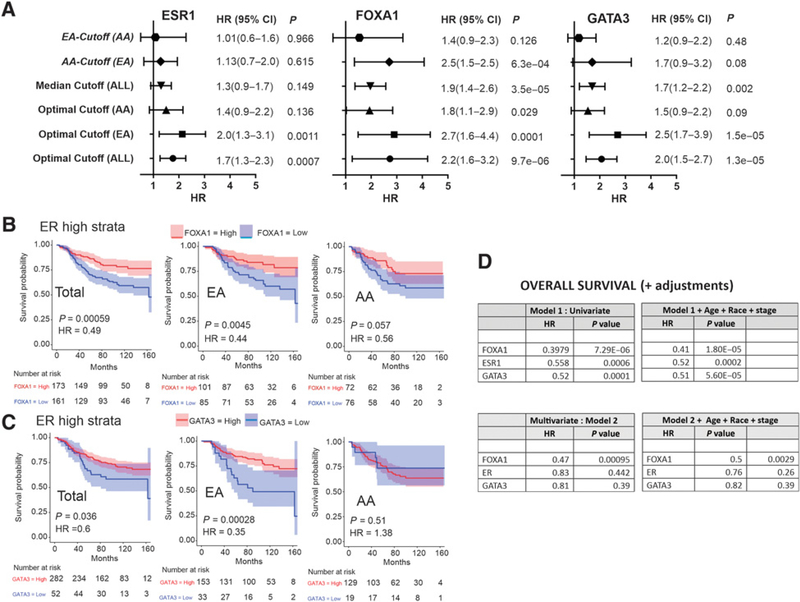
Figure 3.
ER, FOXA1, and GATA3 have different predictive values for overall survival based on race. A, Forest plot of HR of overall breast cancer survival using median and population optimized cutoff H-scores (ALL, EA, and AA) for ESR1, FOXA1, and GATA3 expression. B, Association between FOXA1 expression and survival in low-risk, high-ER-expressing patient with breast cancer, comparing the total population (left) with EA patients (center) and AA patients (right). C, Association between GATA3 expression and survival in low-risk, high-ER-expressing patients with breast cancer, comparing the total population (left) with EA patients (center) and AA patients (right). D, Univariate and multivariate logistic regression models of overall breast cancer survival based on FOXA1, ESR1, and GATA3 expression adjusted for age, race, and stage. 95% CIs are shown in parentheses.

