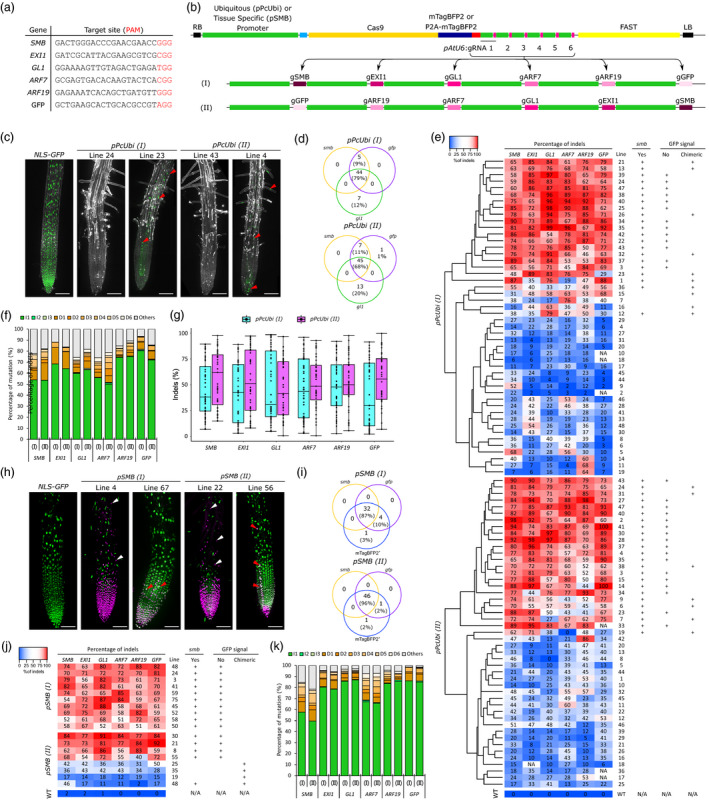
Figure 1.

Ubiquitous and root cap‐specific knockout of 6 genes in T1 via CRISPR and CRISPR‐TSKO. (a) gRNA Target sequences. (b) Diagram of the pPcUBI (Petroselinum crispum UBIQUITIN promoter) and pSMB vectors with gRNAs cloned in an inverted order, (I) and (II). (c) Maximum intensity projections of root tips of a representative NLS‐GFP seedling, two pPcUBI(I) and two pPcUBI(II) T1 seedlings showing the complete (left) and chimeric (right) absence of GFP signal and smb phenotype. GFP is in green, propidium iodide (PI) in grey. Red arrowheads indicate root cells still expressing GFP. Scale bars, 100 µm. (d) Venn diagram showing the number of plants displaying smb, gfp and gl1 mutant phenotype in 96 pPcUBI(I) and 95 pPcUBI(II) T1 seedlings. (e) Genotype analysis by amplicon sequencing. Phenotypes are indicated on the right panel. (f) Frequency of the main mutation types in both pPcUBI(I) and pPcUBI(II) plants. I1–I3: 1‐ to 3‐bp insertion, D1–D6: 1‐ to 6‐bp deletion, Others: bigger deletions (>6‐bp), insertions (>3‐bp) or complex repair outcomes containing both insertions and deletions. (g) Percentage of indels observed in pPcUBI(I) and pPcUBI(II) T1 plants. (h) Maximum intensity projections of root tips of a representative NLS‐GFP seedling, two pSMB(I) and two pSMB(II) T1 seedlings grown on 1 µM brassinazole showing the complete (left) and chimeric (right) absence of GFP and presence of mTagBFP2 signal specific to root cap cells. GFP is in green, mTagBFP2 in magenta. White arrowheads indicate live root cap cells with nuclear mTagBFP2 signal covering the elongation zone. Red arrowheads indicate root cells still expressing GFP. Scale bars, 100 µm. (i) Venn diagrams showing the number of plants displaying strong mTagBFP2 signal, smb and gfp phenotype in 86 pSMB(I) and 88 pSMB(II) T1 seedlings. (j) Genotype analysis of BFP+ sorted cells of pSMB(I) and pSMB(II) T2 seedlings by amplicon sequencing. (k) Frequency of the main mutations types in pSMB(I) and pSMB(II) plants.
