
Figure 1.
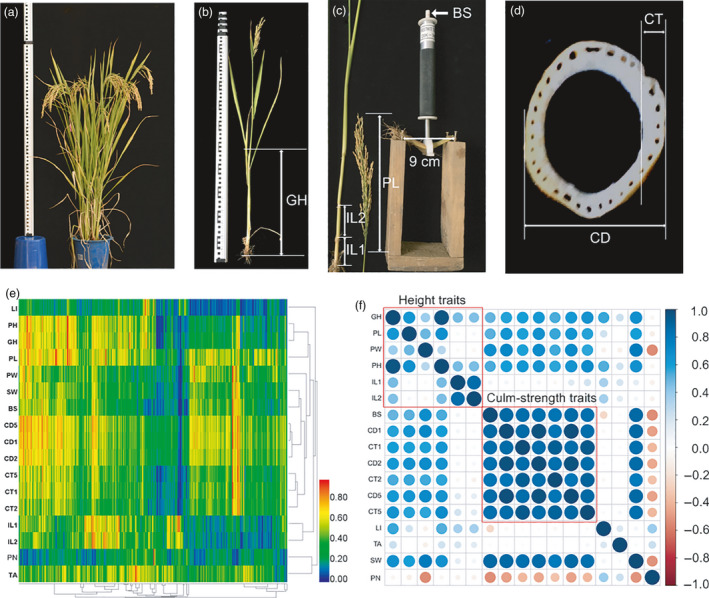
Phenotyping of lodging resistance (LR) related traits in the association mapping population. (a) Plant height measurement (the longest distance from the plant base to the tip of the highest leaf or panicle (whichever is longer)). (b) Culm gravity‐centre height measurement (GH, the distance from culm base to culm gravity‐centre). (c) Measurement of the 1st lowermost internode length from the plant base (IL1), the 2nd internode length (IL2), the panicle length (PL) and the basal culm breaking strength (BS). (d) Measurement of the culm outer diameter (CD) and culm thickness (CT). (e) Heatmap showing the values of 17 LR‐related traits across 524 accessions. The range of values for each trait was transformed to 0‐1 by linear normalization. (f) Correlation matrix diagram showing the correlation coefficients among the 17 traits. The circle with greater diameter and greater colour intensity represents a greater absolute correlation coefficient value. These traits are mainly classified into two groups–height traits and culm‐strength traits.