
Figure 5.
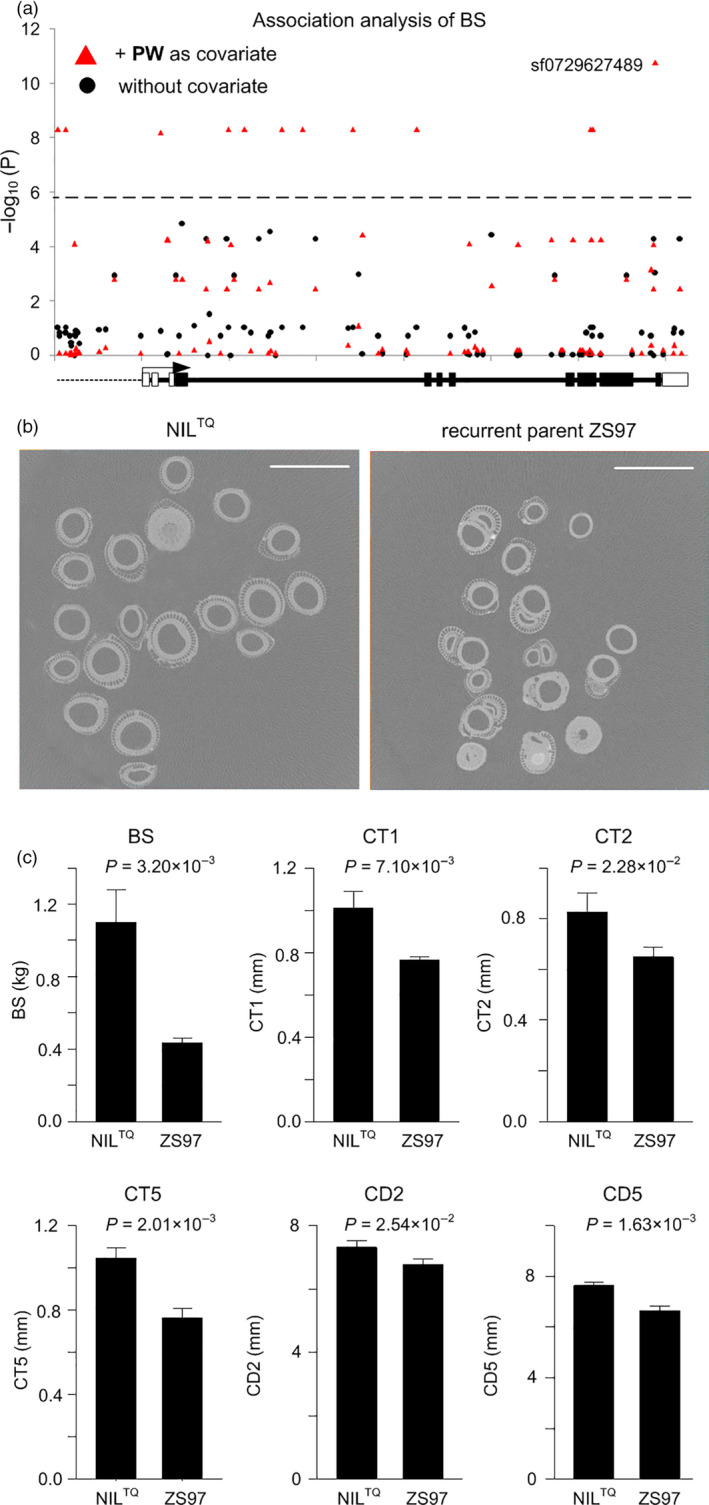
Associations between culm strength and the candidate gene OsPRR37. (a) Local Manhattan plot showing the associations between BS and SNPs across the gene body and the 2‐kb upstream region for the candidate gene OsPRR37 (LOC_Os07g49460) without a covariate (black dots), and with adding PW as a covariate (red triangles) using a linear regression model taking the population structure into account. For gene structure, dotted line, solid lines, white rectangles, black rectangles and black arrow indicate a 2‐kb promoter region, introns, UTRs, exons and transcription direction, respectively. (b) Culm cross‐sections of NILTQ (near‐isogenic line constructed by consecutive backcrossing with Zhenshan 97 as a recurrent parent and TQ as a donor) and its recurrent parent Zhenshan 97, observed by high‐resolution computed tomography. Scale bars, 10 mm. (c) Comparison of phenotypic values of BS, CT1, CT2, CT5, CD2 and CD5 between the NILTQ and Zhenshan 97. P values from the t‐test are shown.