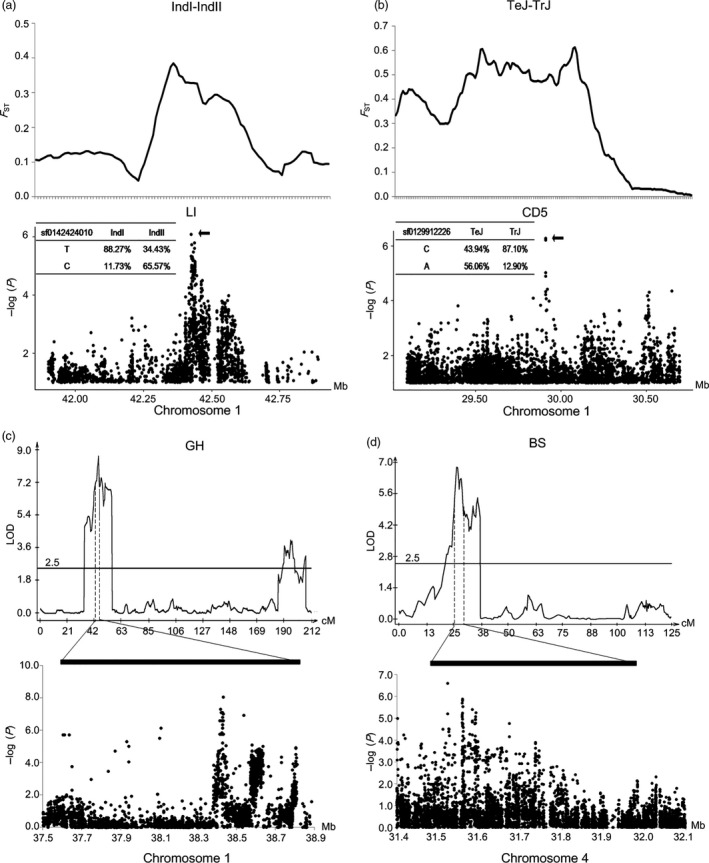
Figure 6.

GWAS loci co‐localized with greatly divergent regions identified by F ST and QTLs identified by linkage analyses. (a) A greatly divergent region between the IndI and IndII subpopulations identified by F ST (first row) covers a GWAS locus associated with LI (second row). (b) A greatly divergent region between the TeJ and TrJ subpopulations identified by F ST (first row) covers a GWAS locus associated with CD5 (second row). (c) A QTL on chromosome 1 controlling GH is identified by both linkage analysis (first row) and association analysis (second row). (d) A QTL on chromosome 4 controlling BS is identified by both linkage analysis (first row) and association analysis (second row).
