
Figure 5.
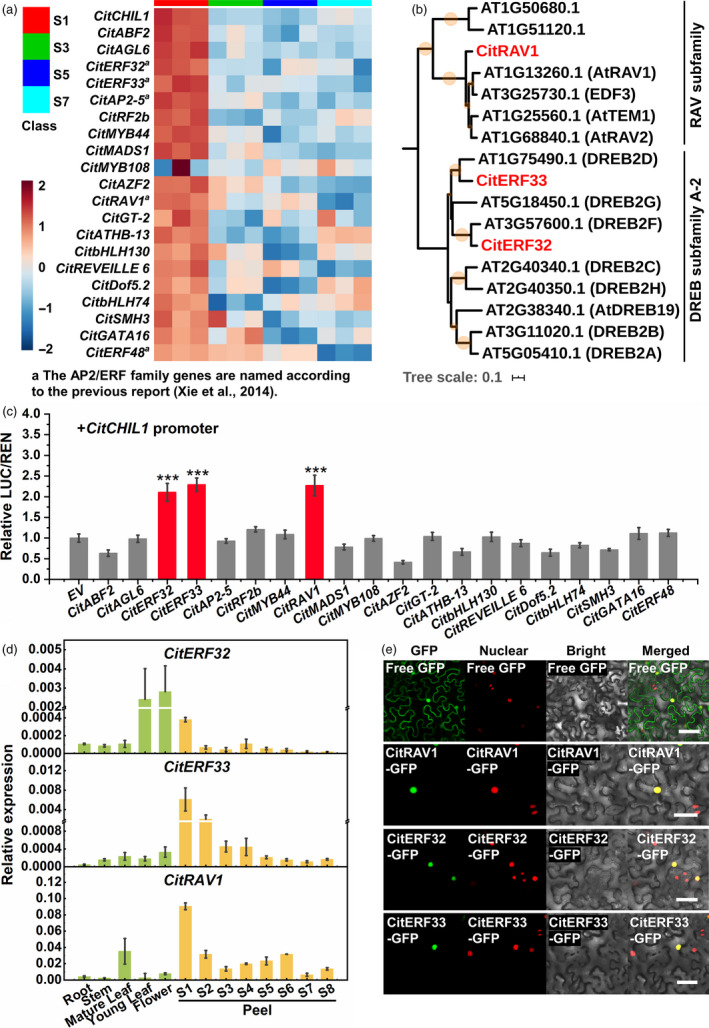
Identification of TFs activating CitCHIL1 promoter. (a) Heatmap of expression profiles of potential TFs in citrus peel during fruit development. The RNA‐seq was conducted with three biological replicates. Transcript abundance of TFs was represented by lg (FPKM value). The heatmap was constructed with online software MetaboAnalyst v.4.0. (b) Phylogenetic analysis of CitERF32, CitERF33, CitRAV1 and members of Arabidopsis DREB A‐2 subfamily and RAV subfamily. The tree was constructed using the neighbour‐joining method. At, Arabidopsis thaliana. The size of orange circles on the branches represents the bootstrap values based on 1000 bootstrap replicates (lower than 50% was cut‐off). The TFs of Citrus are shown in red type. Names of the genes from Arabidopsis are in parentheses. (c) Regulatory effects of potential TFs on the promoter of CitCHIL1. Firefly luciferase/Renilla luciferase (LUC/REN) values obtained with the empty pGreenII‐SK vector and the CitCHIL1 promoter were set as 1, and SE values were calculated from six replicates. Each TFs–promoter interaction was confirmed by three independent experiments, and each experimental point had at least six biological replicates. Statistical significance was determined by one‐way ANOVA and LSD test: ***, P < 0.001. (d) Quantitative RT‐PCR analysis of CitERF32, CitERF33 and CitRAV1 in different tissues and developmental stages of citrus. The transcript levels are expressed relative to citrus β‐Actin transcripts. Values are means ± SE (n = 3). (e) Subcellular localization of CitERF32, CitERF33 and CitRAV1 in transgenic Nicotiana benthamiana leaves (expressed with nucleus‐located mCherry). Empty eGFP vector used as control was the same to the control of Figure 1f. NLS‐mCherry, nucleus‐localized signal. Bars = 50 μm.