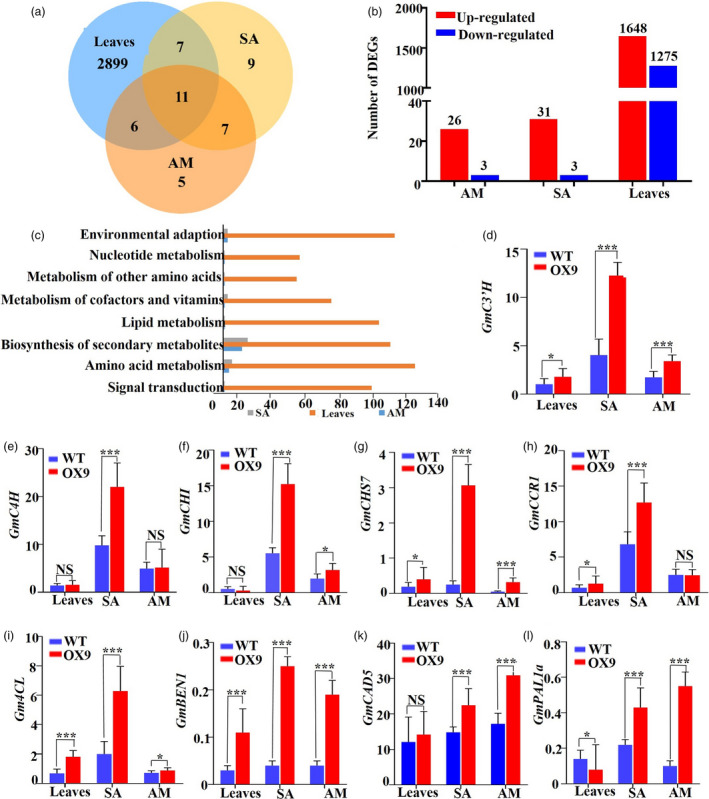
Figure 6.

The classification of differentially expressed genes (DEGs) in OX9 versus wild‐type (WT) plants. (a) Venn diagram analysis of DEGs in the leaf, shoot apex (SA) and axillary meristem (AM) tissues of WT and OX9 plants. (b) The number of DEGs in the leaf, SA and AM tissues of WT and OX9 plants. (c) Pathway terms showing statistically significant enrichment in the number of DEGs in the leaf, SA and AM tissues of WT and OX9 plants. (d–l) Validation of the expression levels of 9 DEGs by qRT‐PCR. Relative expression levels were normalized to the expression level of GmActin. Statistically significant differences between OX9 (in leaves, SA or AM) and WT (in leaves, SA or AM) plants are marked with asterisks (*P < 0.05, **P < 0.01 and ***P < 0.001; Student's t‐test. NS, non‐significant).
