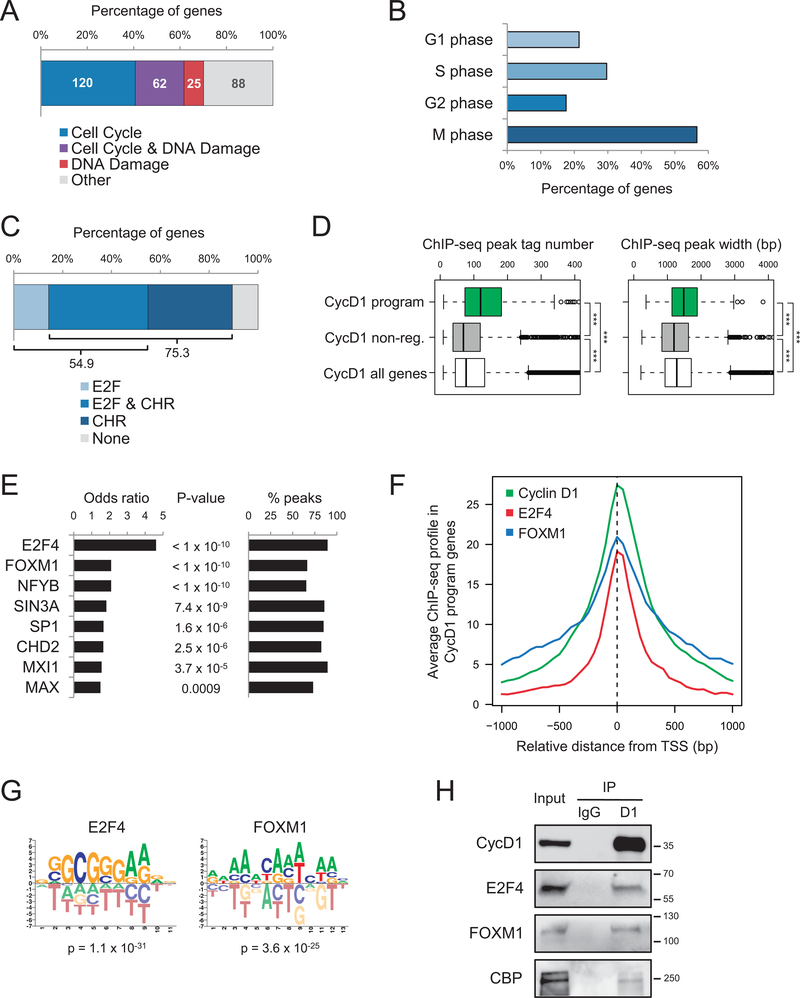
Figure 2. Cyclin D1 promotes the activation of a cell cycle transcriptional program.
(A) GO analysis of cyclin D1-dependent gene expression program (n = 295) showing the number and the percentage of genes involved in cell cycle (p = 3.4 × 10−116), DNA damage response (p = 2.4 × 10−47), or both. (B) Percentage of cell cycle genes from the cyclin D1-dependent transcriptional program (n = 182) corresponding to the four cell cycle phases according to GO categories. G1 corresponds to “cell cycle G1/S phase transition” (p = 1.4 × 10⁻²⁶), S to “DNA replication” (p = 1.3 × 10−64), G2 to “cell cycle G2/M phase transition” (p = 5.9 × 10⁻²²), and M to “cell division” (p = 6.7 × 10−61) and “chromosome segregation” (p = 6.4 × 10−56). Genes belonging to more than one category were included in all of them. (C) Analysis of DNA motifs related to cell cycle transcriptional control in the cyclin D1 peaks present in the promoters of cyclin D1-activated genes. Statistical assessment by Fisher’s test in comparison to all gene promoters resulted in p < 2.2 × 10⁻¹⁶ for E2F and p = 0.003 for CHR sites. (D) Boxplots of cyclin D1 ChIP-seq peak tag number and width, corresponding to the cyclin D1-activated genes (n = 295), cyclin D1 non-regulated genes (n = 2,752), and all cyclin D1 target genes (n = 8,638). Statistical significance was assessed by two-tailed Student’s t-test, ***: p < 0.0001. (E) Colocalization analysis between cyclin D1 peaks and transcriptional regulators from the ENCODE database (GM12878 cells) in the cyclin D1-activated genes. Statistical significance was assessed by Fisher’s test in comparison with cyclin D1 non-regulated genes. Percentages of cyclin D1-activated genes containing a peak of the corresponding transcription factor overlapping with the cyclin D1 peak are indicated; only the transcription factors present in more than 50% of genes were selected. (F) ChIP-seq profiles of cyclin D1 (in JeKo-1 cells) and E2F4 and FOXM1 (in GM12878 cells) around the transcription start site (TSS) from the cyclin D1-dependent program genes. (G) Enrichment of E2F4 and FOXM1 motifs in cyclin D1 peaks present in cyclin D1-activated gene promoters. (H) Co-IP experiments of endogenous cyclin D1 with E2F4, FOXM1, and CBP in JeKo-1 cells. IgG was used as a control. Molecular weights (in kDa) are indicated.

