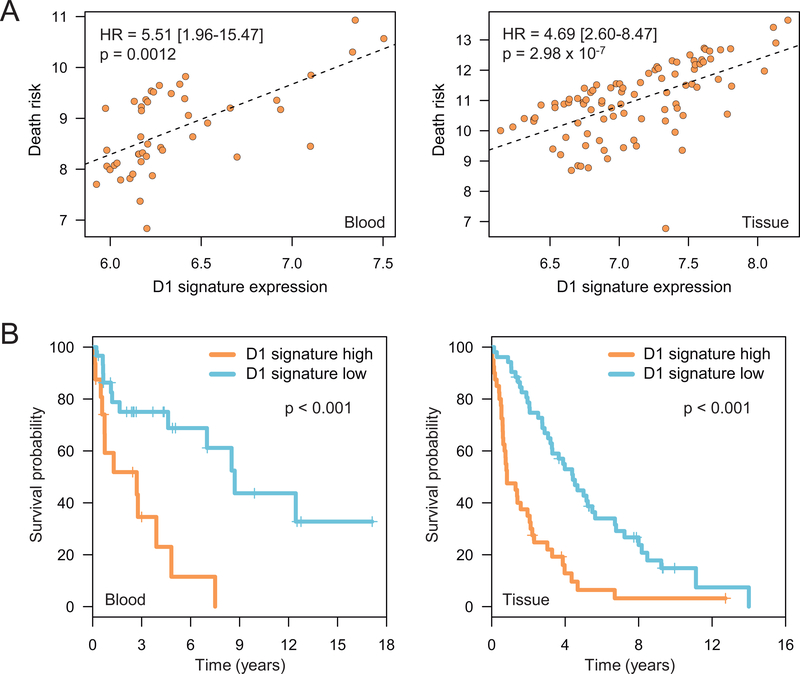
Figure 4: Expression levels of cyclin D1-dependent program correlate with survival in MCL patients.
(A) Association between the 295-gene cyclin D1 signature score and the death risk in MCL primary cases, from both peripheral blood and lymphoid tissue samples. The death risk (y-axis) corresponds to the sum of the martingale residuals and the linear predictors of the fitted OS Cox model; hazard ratios (HR) with 95% confidence interval and p-values are shown. (B) Kaplan-Meier curves of OS from diagnosis date corresponding to 295-gene cyclin D1 signature high and low MCL groups, in peripheral blood (high n = 16; low n = 30) and lymphoid tissue (high n = 40; low n = 52) samples.

