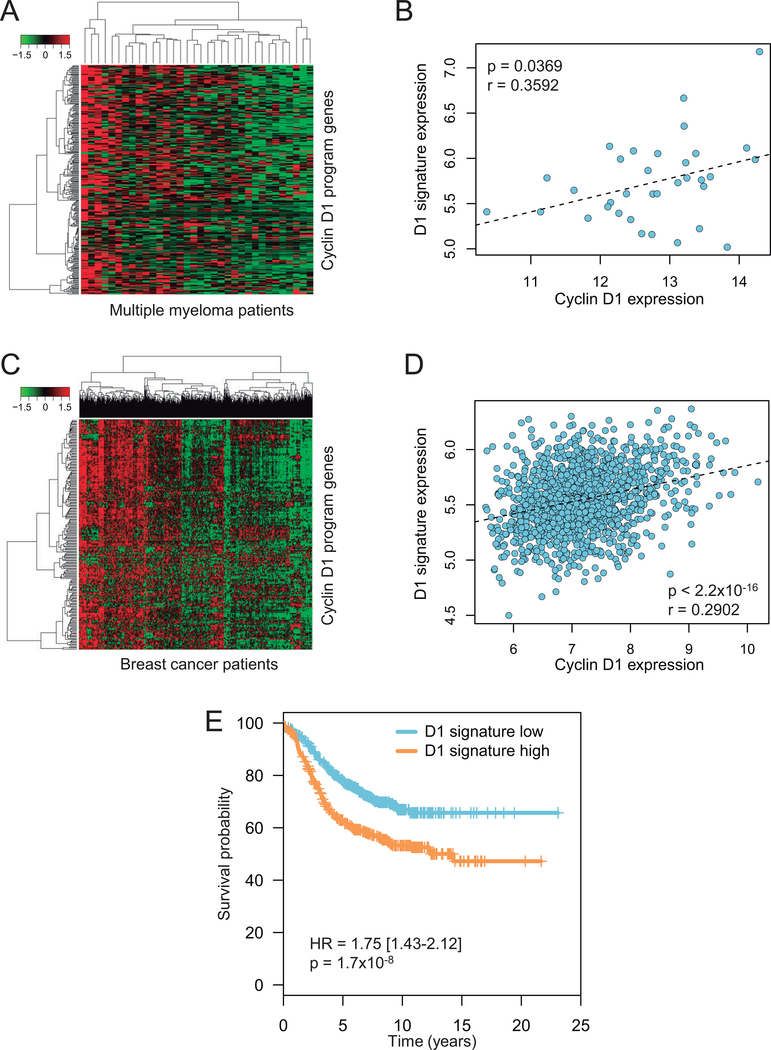
Figure 6: Cyclin D1-dependent transcriptional program in other cyclin D1-overexpressing tumors.
(A) Heatmap and hierarchical clustering analysis of cyclin D1-dependent gene program in multiple myeloma; only patients from the CD-2 molecular subclass, characterized by a high prevalence of t(11;14) translocation, were selected (n = 34). (B) Correlation between cyclin D1 expression and the 295-gene cyclin D1 signature score in multiple myeloma. Correlation was assessed by Pearson’s r. (C) Heatmap and hierarchical clustering analysis of cyclin D1-dependent gene program in ER-positive breast cancer patients (n = 1399). (D) Correlation between cyclin D1 expression and the 295-gene cyclin D1 signature score in ER-positive breast cancer. Correlation was assessed by Pearson’s r. (E) Kaplan-Meier curves of the progression free survival in ER-positive breast cancer patients splitted in “high” and “low” groups based on the median value of the 37-gene cyclin D1 signature.

