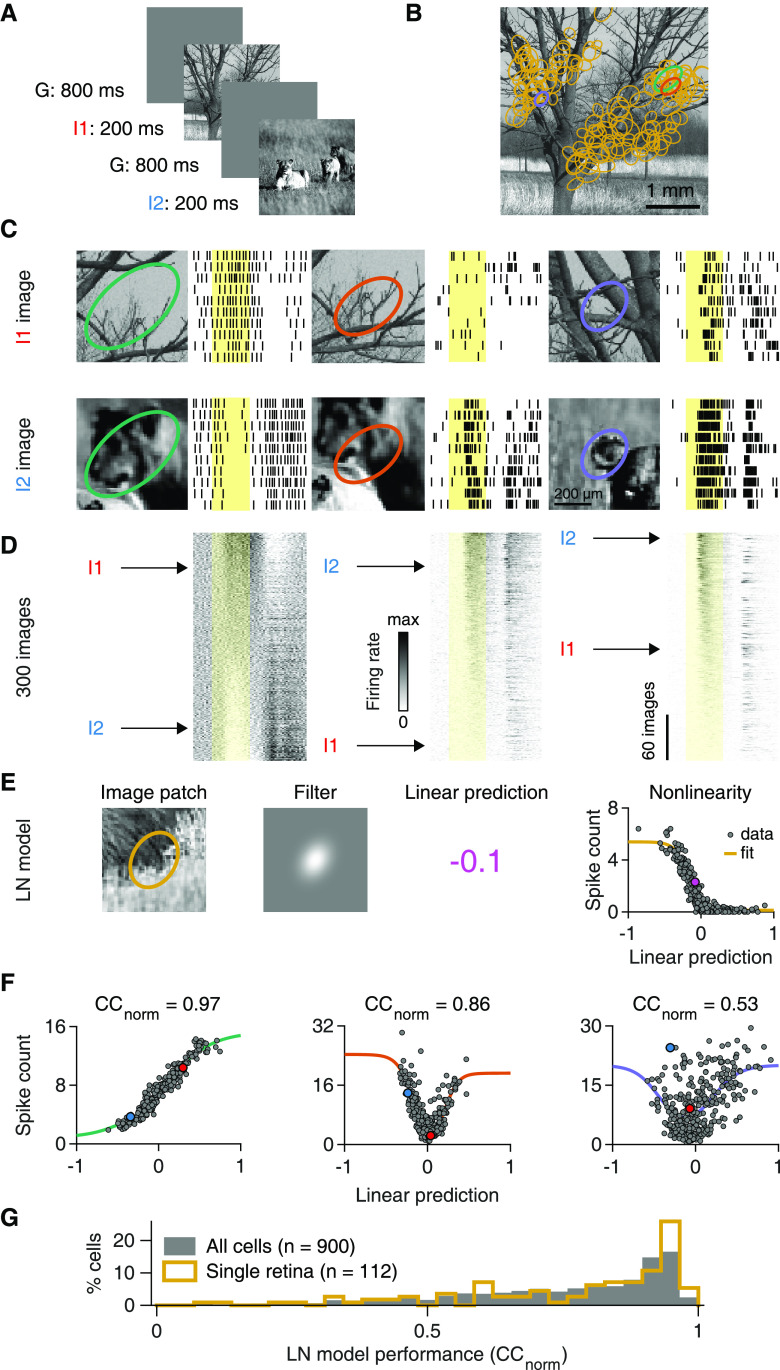
Figure 1.
A spatially linear RF model often fails to predict natural image responses of RGCs. A, Natural images were presented to the retina in a pseudorandom sequence for 200 ms with an interstimulus interval of 800 ms. B, Sample natural image (I1). Overlaid ellipses (light orange) represent the outlines of RF centers (center parts of difference-of-Gaussians fits) of 130 RGCs from a single recording. The midline is RF-free because it contained the optic disk region. C, Top, Raster plots with responses of three different ganglion cells to 10 presentations of image I1. Different RF outline colors correspond to different cells, also highlighted in B. Bottom, Same as in top, but for presentations of another image (I2). Yellow-shaded areas correspond to the 200 ms image presentations. D, PSTHs for 300 natural images, aligned to the raster plots of (C) and sorted by the average spike count during stimulus presentation. Rows corresponding to images I1 and I2 are marked. E, The structure of an LN model that we used to predict average spike counts for natural images. The linear prediction is the inner product of the contrast values in the image patch and the filter. F, Spiking nonlinearities fitted to observed spike counts for the three sample cells of C. Data points for images I1 and I2 are highlighted. Top, The obtained normalized correlation coefficients (CCnorm). G, LN model performance distribution for ganglion cells in a single retina preparation (light orange, same as in B), and for all recorded cells (gray) from 13 preparations (9 animals).

