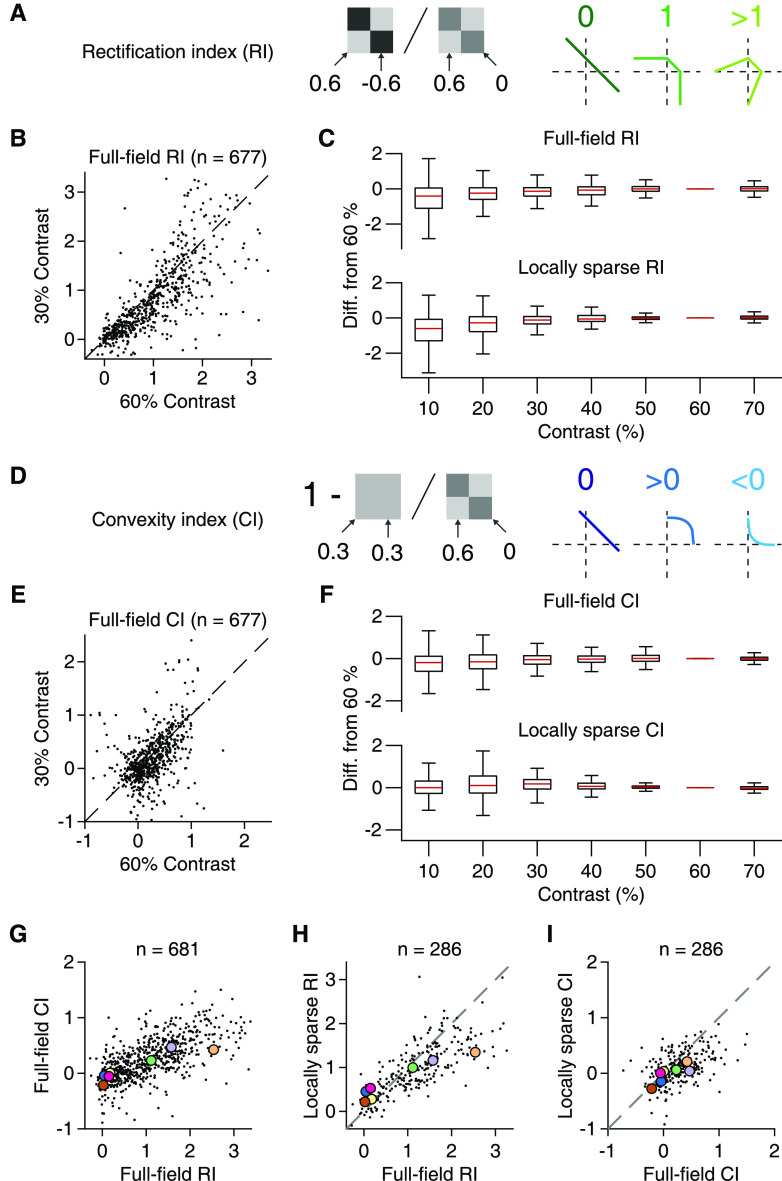
Figure 6.
Rectification and convexity indices quantify iso-response contour shapes across contrast levels. A, Schematic depiction of how rectification indices were computed from responses to different contrast combinations and how they relate to different shapes of contour lines. As indicated, the RI resulted from a ratio of responses when the tiles had opposing contrast (here 0.6 and −0.6) and when only one component was used (0.6 and 0). B, Comparison of full-field rectification indices calculated for 30% and 60% contrast. C, Rectification indices for different contrast levels and presentation modes (top: full-field, n = 695; bottom: local, n = 289). To compare with our default of 60%, values are shown as differences from the default. Each box represents the interquartile range (25th and 75th percentile), along with the median (red line). The whiskers extend to the maximal and minimal values, with outliers excluded (defined as data points >1.5 times the interquartile range away from the box). D, Same as in A, but for the CI. The CI was computed by comparing the responses when stimulation was homogeneous (here both contrast values at 0.3) and when only one component was used (contrast values 0.6 and 0) and subtracting the ratio of these responses from unity. E, F, Same as in B, C, but for the convexity indices. G, Relation of full-field RI and CI in the pooled ganglion cell data from 13 retinas (9 animals). Colored dots correspond to the sample cells from Figure 5. H, Relation of full-field and locally sparse rectification indices in the pooled ganglion cell data from 6 retinas (4 animals). Dashed line indicates the equality line. I, Same as in H, but for convexity indices.

