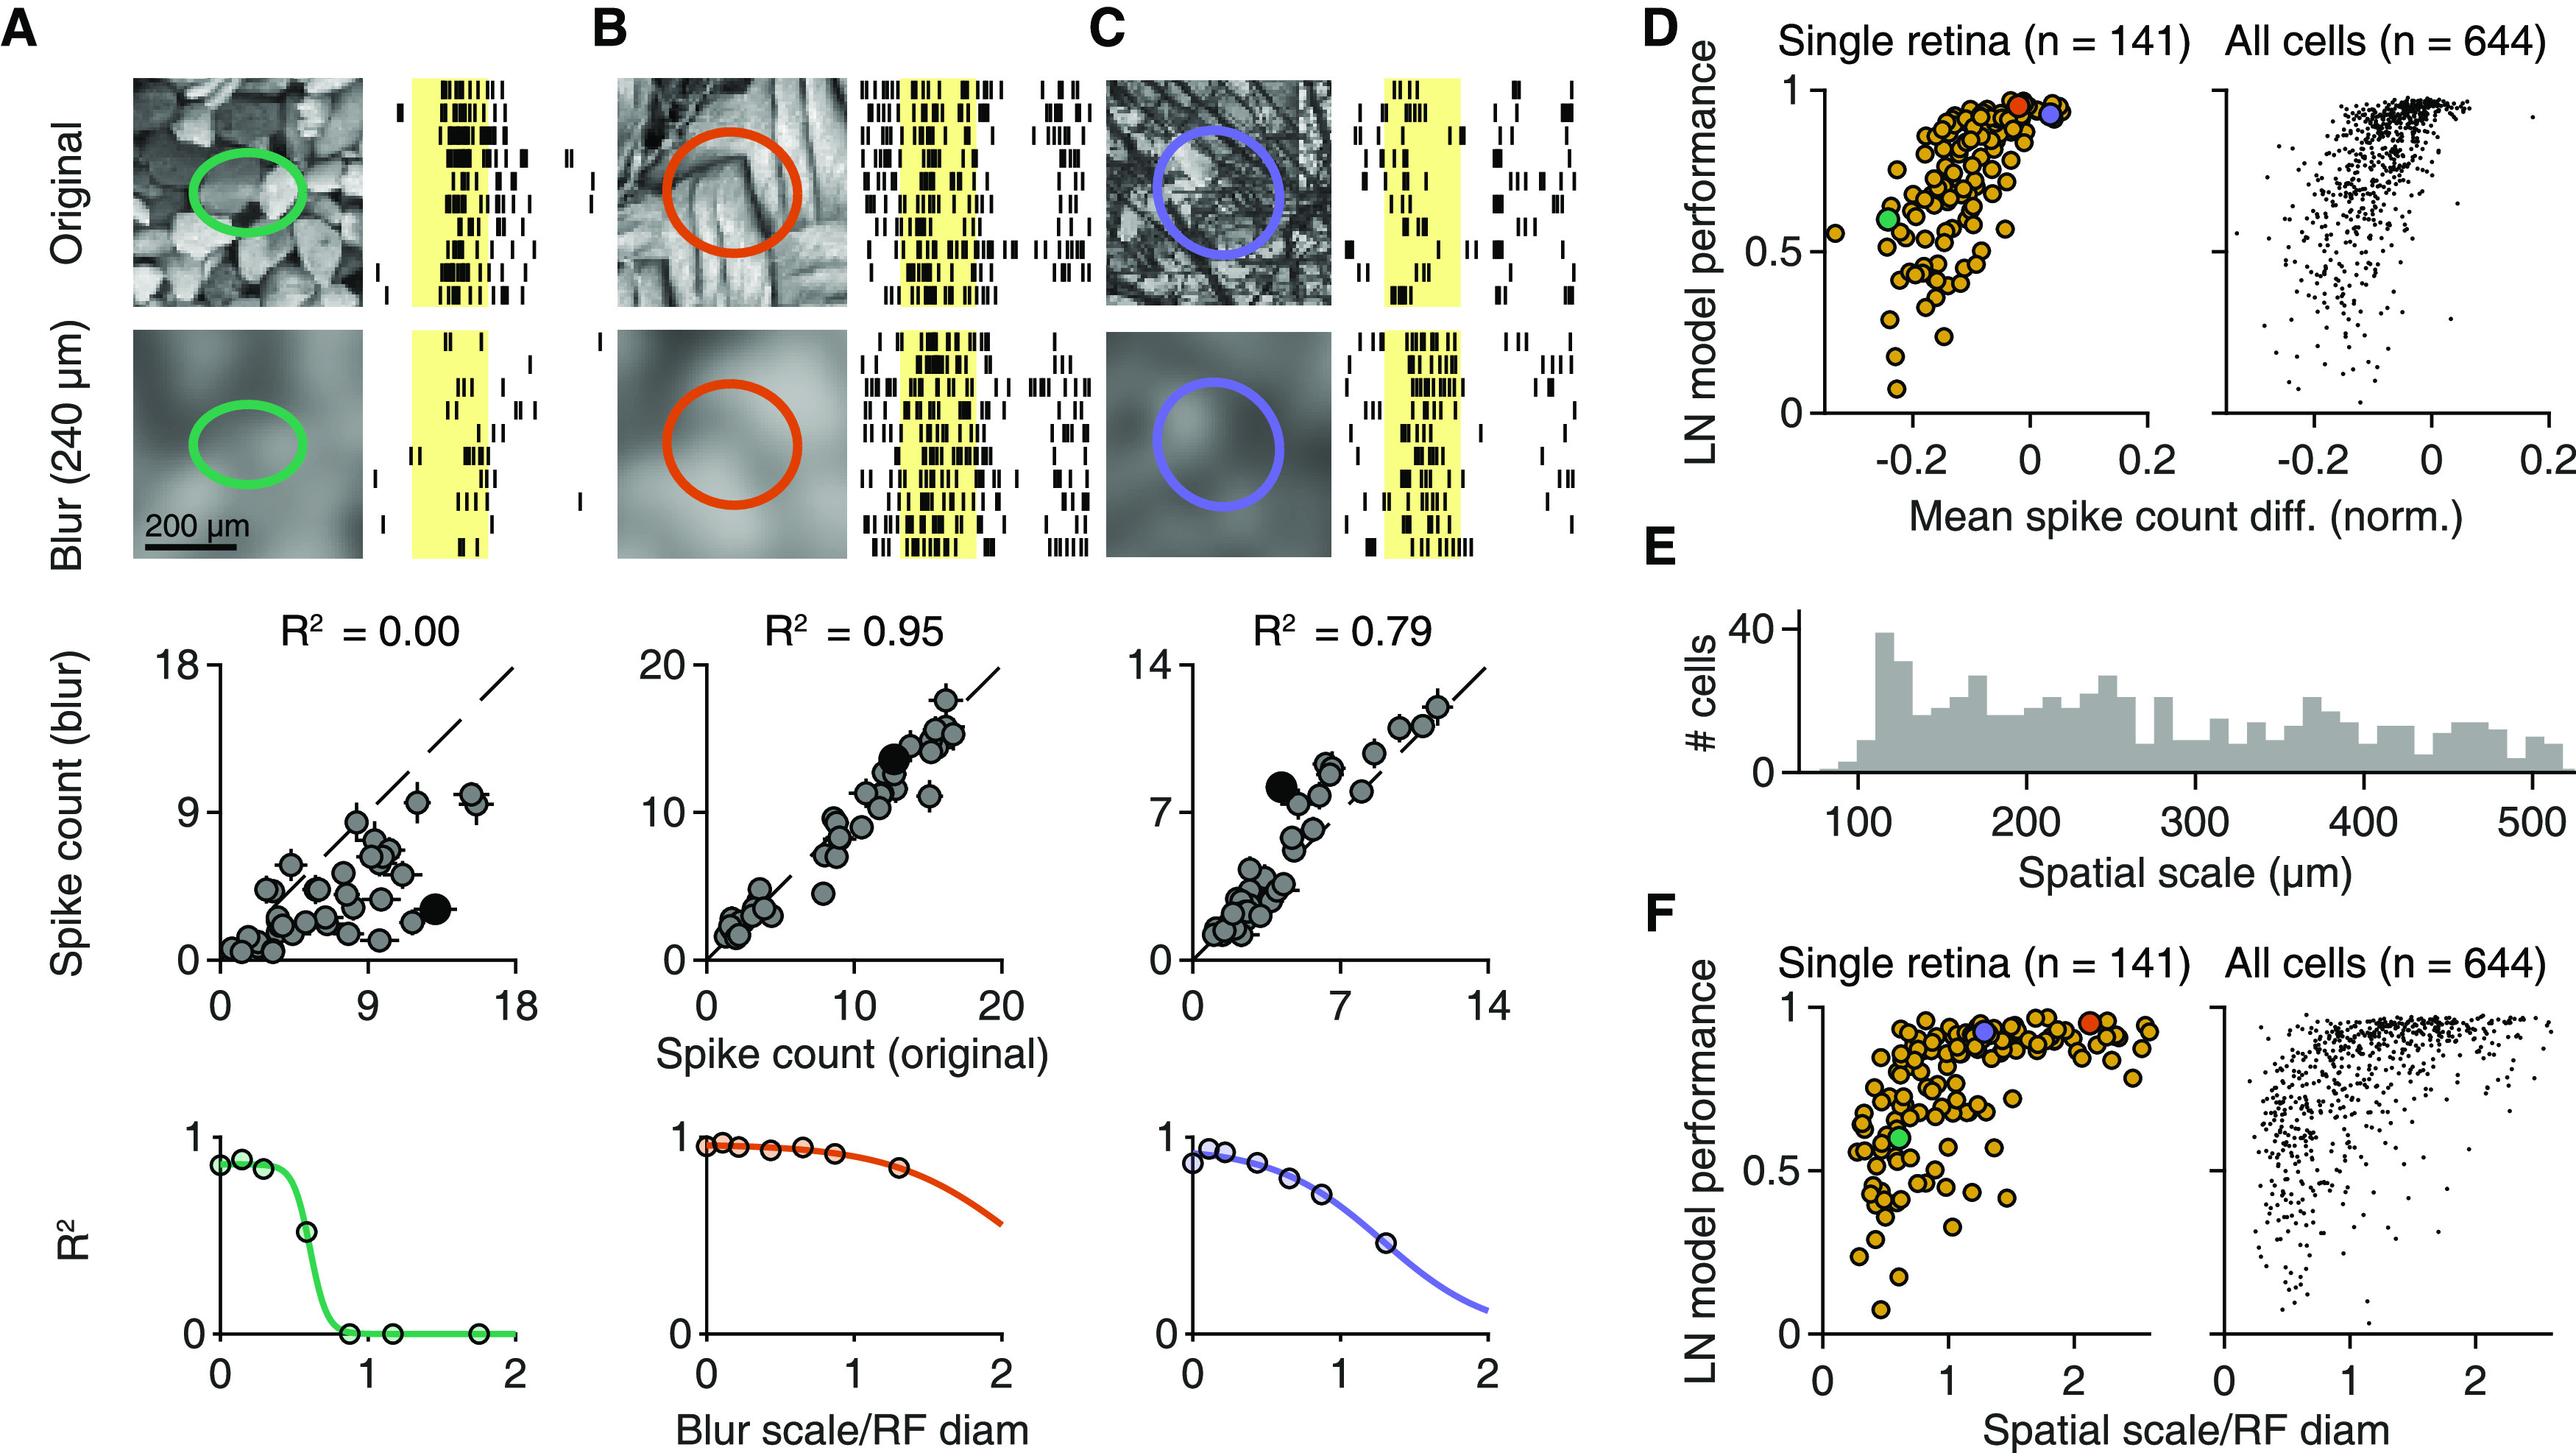
Figure 8.

The scale of SC sensitivity for natural images. A–C, Top, Responses of three sample cells to original natural images and their blurred versions for 10 trials. Images were blurred with a Gaussian function (scale 4σ = 240 μm). Shaded yellow areas represent the 200 ms image presentations. Middle, Relation of the average spike count for presentations of 40 natural images and their blurred counterparts for each of the three cells. Filled black dots correspond to the image pairs shown above. Error bars indicate SEM. Dashed line indicates the equality line. Bottom, Coefficient of determination (R2) between original and blurred spike counts for different degrees of blurring, normalized by the RF diameter of each cell. Colored lines indicate logistic fits. D, Relation between LN model performance for natural images and the mean (across images) spike count difference between blurred (4σ = 240 μm) and original images for each cell from a single retina (left, Spearman's ρ = 0.75, p < 10−3) and from the pooled ganglion cell population (right, Spearman's ρ = 0.68, p < 10−3) from 9 retinas (6 animals). The differences were normalized to the maximum average spike count observed for each cell. Cells from A–C are highlighted. E, The distribution of spatial scales across the pooled ganglion cell population (n = 644). The spatial scale was defined as the midpoint of fitted logistic functions (compare A–C, bottom). F, Relation of spatial scale, normalized by the RF diameter, to LN model performance for natural images for a single retina (left, Spearman's ρ = 0.63, p < 10−3) and for the pooled ganglion cell population (right, Spearman's ρ = 0.61, p < 10−3) from 9 retinas, 6 animals. Cells from A–C are highlighted.
