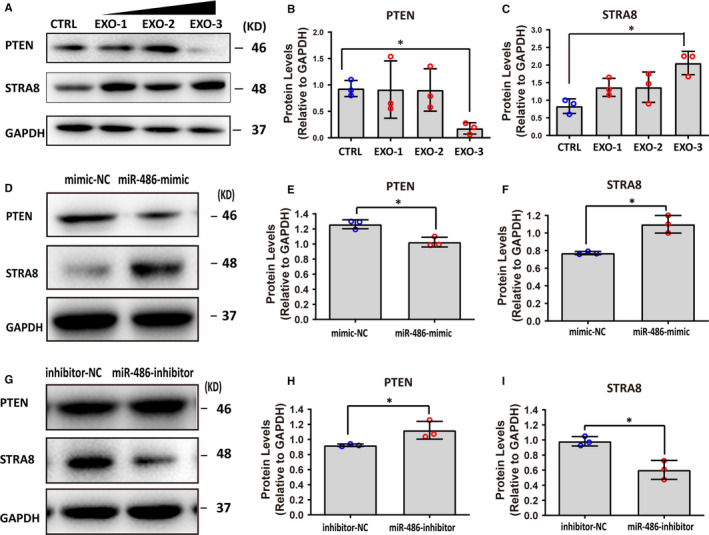
FIGURE 6.

miR‐486‐5p derived from SCs promoted differentiation of SSC through the PTEN/STRA8 axis. A‐C, SC‐EXO suppressed expression of PTEN and up‐regulated STRA8 expression in SSCs. SSCs treated with SC‐EXO at defined concentrations for 48 h. EXO‐1: 4.44 × 10⁹ particles/mL, EXO‐2: 8.88 × 10⁹, EXO‐3: 1.33 × 10¹⁰ particles/mL. A, Representative Western blot image. (B‐C) Summary of the protein levels of PTEN and STRA8 in (A). GAPDH served as a loading control. Data points were obtained from three independent experiments and were presented as mean ± SD, *P < 0.05. D‐F, Western blot analysis of PTEN and STRA8 in SSCs co‐cultured with SC transfected with miR‐486 mimic or NC for 48 h. D, Representative Western blot image. (E‐F) Summary of the protein levels of PTEN and STRA8 in (D). GAPDH served as a loading control. mimic‐NC: SCs were transfected with miR‐486 mimic NC; miR‐486‐mimic: SCs were transfected with miR‐486 mimic. Data points were obtained from three independent experiments and were presented as mean ± SD, *P < 0.05. G‐I, Western blot analysis of PTEN and STRA8 in SSCs co‐cultured with SC transfected with miR‐486 inhibitor or NC for 48 h. G, Representative Western blot image. (H‐I) Summary of the protein levels of PTEN and STRA8 in (D). GAPDH served as a loading control. inhibitor‐NC: SCs were transfected with miR‐486 inhibitor NC; miR‐486 inhibitor: SCs were transfected with miR‐486 inhibitor. Data points were obtained from three independent experiments and were presented as mean ± SD, *P < 0.05
