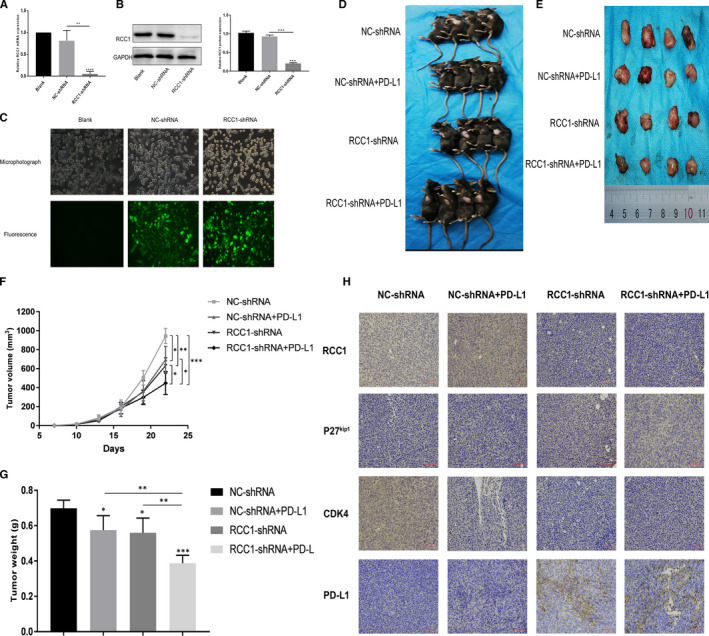
FIGURE 6.

RCC1‐shRNA plus PD‐L1 monoclonal antibody suppressed tumor growth in vivo. (A, B and C) Established a stable RCC1‐shRNA knockdown transfectant‐ RCC1‐shRNA‐Lewis and the negative control line detected by qPCR, Western blot and Fluorescence. (D and E) Image of the tumors before and after we resected. (F and G) Growth curve of tumors volume and tumors weight in 4 groups. (H) Representative images of immunohistochemistry (IHC) staining and stained for RCC1, p27kip1, CDK4 and PD‐L1. Data are shown as the mean ± SD. *P < .05, **P < .01 and ***P < .001
