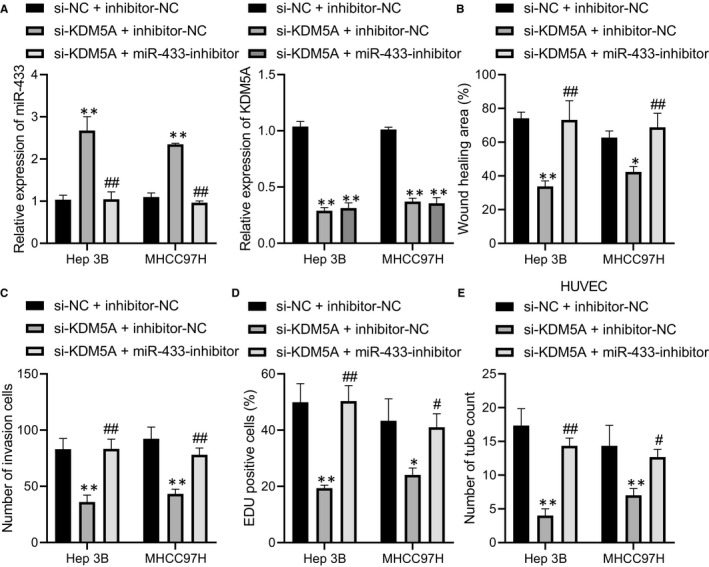
FIGURE 4.

Depletion of KDM5A up‐regulated miR‐433 to suppress HCC angiogenesis and progression. A, the expression levels of miR‐433 and KDM5A after restoration of miR‐433 in KDM5A‐silenced Hep3B and MHCC97H cells determined by RT‐qPCR. B, the effect of miR‐433 restoration on the migrative capacity of KDM5A silenced Hep3B and MHCC97H cells determined by scratch assay. C, the effect of miR‐433 restoration on invasive capacity of KDM5A silenced Hep3B and MHCC97H cells determined by transwell assay. D, the effect of miR‐433 restoration on proliferative capacity of KDM5A silenced Hep3B and MHCC97H cells determined by EDU assay. E, the effect of miR‐433 restoration on angiogenesis of KDM5A silenced Hep3B and MHCC97H cells determined by pseudo‐tube formation assay. *P < .05; **P < .01, compared to si‐NC+ inhibitor‐NC. #P < .05; ##P < .01, compared to si‐KDM5A+ inhibitor‐NC. Data were shown as the mean ± standard deviation. Statistical comparisons were performed by Tukey's test‐corrected one‐way ANOVA when more than two groups were compared. The experiment was repeated 3 times
