
FIGURE 7.
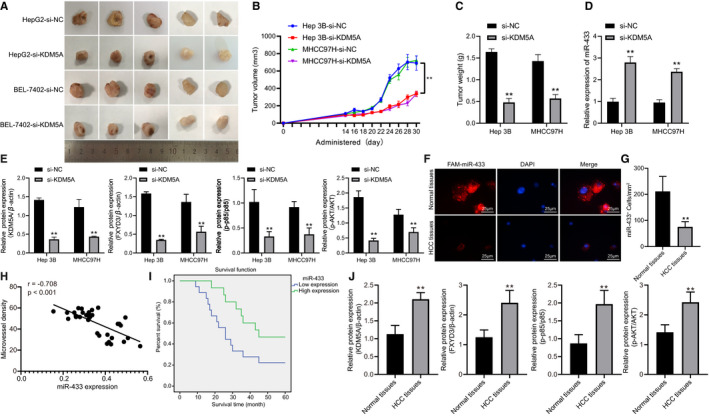
KDM5A regulates miR‐433‐FXYD3‐PI3K‐AKT axis to promote HCC tumorigenesis. A, Representative images of xenograft tumours after subcutaneous injection for 30 days. B, volume of xenograft tumours after subcutaneous injection at different time points. C, weights of xenograft tumours after subcutaneous injection for 30 days. D, expression of miR‐433 in mice xenografted with tumours determined by RT‐qPCR. E, protein levels of KDM5A, FXYD3, p‐p85/p85 and p‐AKT/AKT in xenograft tumours detected by Western blot, N = 5. F, expression of miR‐433 in biopsy specimens determined by FISH. G, quantification of FISH, N = 33. H, Pearson's correlation analysis of correlation between miR‐433 and angiogenesis (microvessel density) in clinical samples. I, Kaplan‐Meier survival analysis of correlation between miR‐433 and overall survival rates, N = 33. J, protein levels of KDM5A, FXYD3, p‐p85, p85, p‐AKT and AKT in clinical samples detected by Western blot, N = 33. *P < .05; **P < .01, compared to Normal tissues. Data were shown as the mean ± standard deviation. Statistical comparisons were performed by Tukey's test‐corrected one‐way ANOVA when more than two groups were compared. The experiment was repeated 3 times