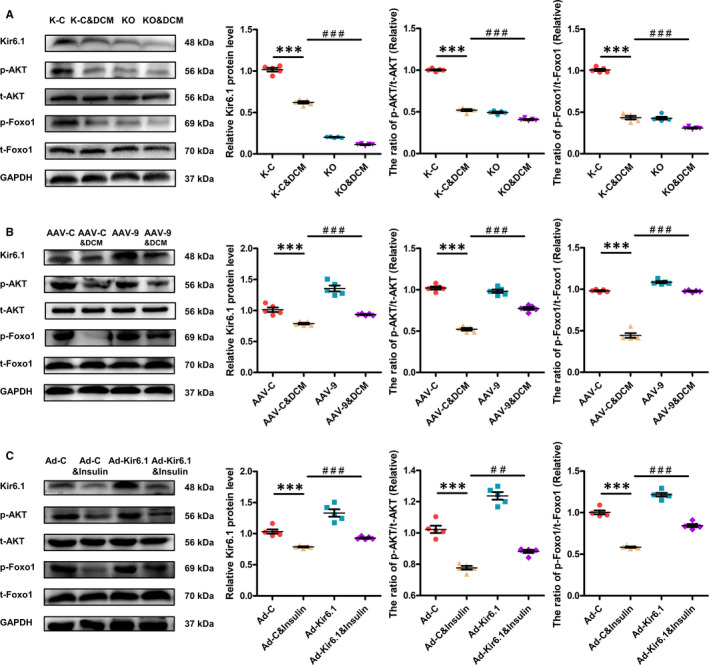
FIGURE 5.

Effect of Kir6.1 on the AKT‐FoxO1 signalling pathway in DCM. A, Western blotting was performed to quantify the expression levels of Kir6.1, p‐AKT and p‐FoxO1 in the heart of mice. Values are expressed as the mean ± SEM. N = 5 mice in each group. P‐values from ANOVA: ***P < .001 vs. control, ###P < .001 vs. DCM group. B, Western blotting was performed to quantify the expression levels of Kir6.1, p‐AKT and p‐FoxO1 in the heart of mice. Values are expressed as the mean ± SEM. N = 5 mice. P‐values from ANOVA: ***P < .001 vs. control, ###P < .001 vs. DCM group. C, Western blotting was performed to quantify the expression levels of Kir6.1, p‐AKT and p‐FoxO1 in NRVMs. Values are expressed as the mean ± SEM. N = 5 independent experiments in each group. P‐values from ANOVA: ***P < .001 vs. control, ##P < .01 vs. Insulin group, ###P < .001 vs. Insulin group
