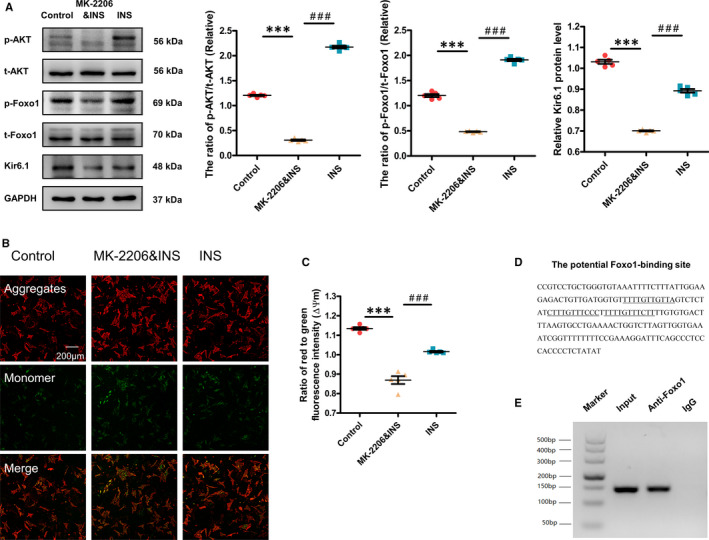
FIGURE 6.

Effect of the AKT‐FoxO1 signalling pathway in regulating Kir6.1 expression and mitochondrial function in cardiomyocytes. A, Western blotting was performed to quantify the expression levels of Kir6.1, p‐AKT and p‐FoxO1 in cardiomyocytes. Values are expressed as the mean ± SEM. N = 5 independent experiments in each group. P‐values from ANOVA: ***P < .001 vs. control, ###P < .001 vs. MK‐2206&INS group. B, Determination of ΔΨm in the three groups of cardiomyocytes by the fluorescent dye, JC‑1 (Scale bar = 200 μm). C, Comparison of the ΔΨm among the three groups of cardiomyocytes. For quantification, 20 cells were randomly selected to calculate the ΔΨm levels by comparing red fluorescent intensity to green fluorescent intensity. Values are expressed as the mean ± SEM. N = 5 independent experiments. P‐values from ANOVA: ***P < .001 vs. control, ###P < .001 vs. MK‐2206&INS group. D, Potential FoxO1‐binding sites are located 2.0 kb upstream of the Kir6.1 gene's transcription initiation site. E, Binding of endogenous FoxO1 from the hearts of mice to the potential FoxO1‐binding site was confirmed by the chromatin immunoprecipitation assay. Representative results from three independent experiments are shown
