Figure 1.

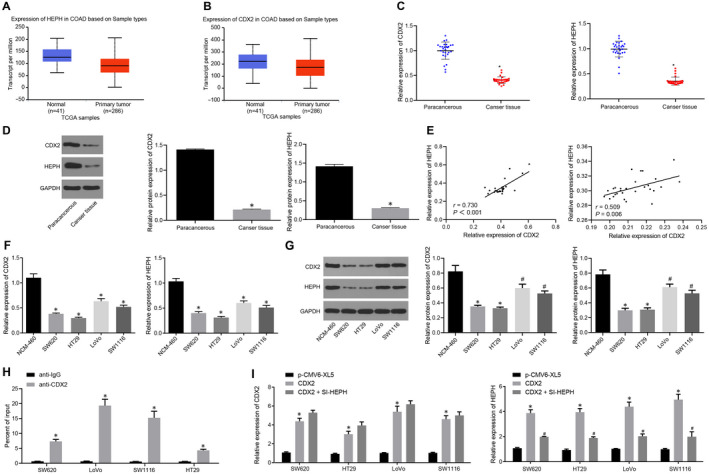
CDX2 and HEPH are poorly expressed in CC tissues and cells. A and B, HEPH and CDX2 expression in colon adenocarcinoma (COAD) samples of TCGA database, respectively. The red box plot represents the tumour samples, and the blue box plot represents the normal samples. C and D, CDX2 and HEPH expression in clinical samples of CC tissues and adjacent tissues determined by RT‐qPCR and Western blot analysis normalized to GAPDH (n = 28). E, Analysis correlation of mRNA (left) and protein (right) expression between CDX2 and HEPH in clinical samples of CC using the Spearman correlation test. F and G, CDX2 and HEPH expression in NCM‐460 cells and 4 CC cells (SW620, HT29, LoVo, SW1116) measured by RT‐qPCR and Western blot analysis normalized to GAPDH. H, The binding relationship between CDX2 and HEPH verified by ChIP experiment. I, CDX2 and HEPH expression in CC cells detected by RT‐qPCR after CC cells (SW620, HT29, LoVo and SW1116) was transfected with p‐CMV6‐XL5 empty vector, p‐CMV6‐XL5‐CDX2 (CDX2), or p‐CMV6‐XL5‐CDX2 + Si‐HEPH (CDX2 + si‐HEPH) normalized to GAPDH. * P < .05 vs adjacent tissues, NCM‐460 cells, anti‐IgG or CC cells transfected with pCMV6‐XL5. # P < .05 vs CC cells transfected with CDX2. Measurement data were expressed as mean ± standard deviation. Data of clinical samples were compared using paired t test, and data between two groups were analysed by unpaired t test. Comparisons among multiple groups were conducted by one‐way analysis of variance (ANOVA), followed by Bonferroni's post hoc test. Each cell experiment was repeated three times
