
Figure 2.
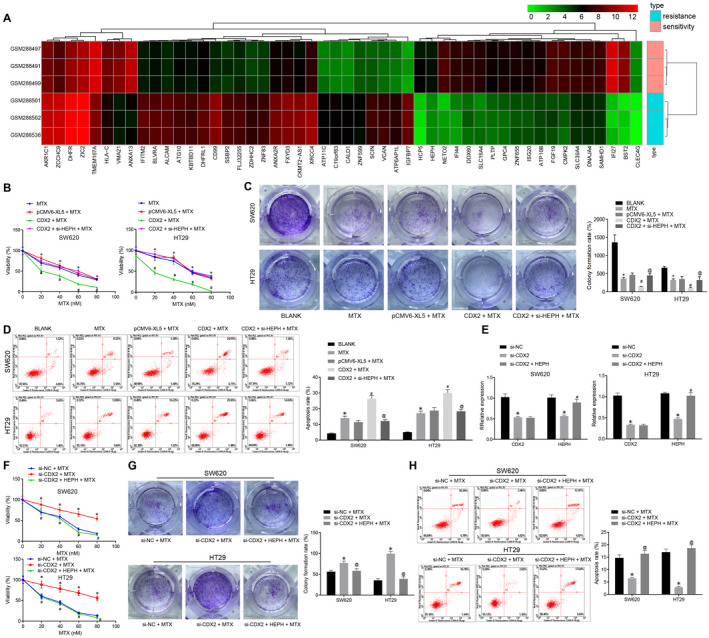
CDX2 overexpression up‐regulates HEPH to repress CC cell resistance to MTX. A, Heat map of differentially expressed genes in MTX‐resistant CC expression profile GSE11440. The abscissa refers to the sample number, the ordinate refers to the gene name, the left tree indicates the gene expression cluster, and the upper tree indicates the sample cluster. The upper right histogram was colour gradation, and each square in the FIGURE represents the expression of a gene in a sample. B, Cell viability of SW620 and HT29 cells transfected with CDX2 and si‐HEPH after 5 d of MTX treatment detected by CCK‐8 assay. C, Colony formation of MTX‐treated SW620 and HT29 cells after transfection with CDX2 and si‐HEPH assessed by colony formation assay. D, Apoptosis of MTX‐treated SW620 and HT29 cells after transfection with CDX2 and si‐HEPH examined by flow cytometry assay. E, CDX2 and HEPH expression in MTX‐treated SW620 and HT29 cells after transfection with si‐CDX2 and HEPH measured by RT‐qPCR normalized to GAPDH. F, Cell viability of SW620 and HT29 cells transfected with CDX2 and si‐HEPH after 5 d of MTX treatment detected by CCK‐8 assay. G, Colony formation of MTX‐treated SW620 and HT29 cells after transfection with si‐CDX2 and HEPH assessed by colony formation assay. H, Apoptosis of MTX‐treated SW620 and HT29 cells after transfection with si‐CDX2 and HEPH analysed by flow cytometry. * P < .05 vs. SW620 and HT29 cells without any treatment or MTX‐treated SW620 and HT29 cells. # P < .05 vs. MTX‐treated SW620 and HT29 cells transfected with pCMV6‐XL5. @ P < .05 vs. MTX‐treated SW620 and HT29 cells transfected with CDX2 or si‐CDX2. Measurement data were expressed as mean ± standard deviation. Comparisons among multiple groups were conducted by one‐way analysis of variance (ANOVA). Data at different time‐points were compared by repeated‐measures ANOVA, followed by Bonferroni's post hoc test. Each cell experiment was repeated three times