
FIGURE 3.
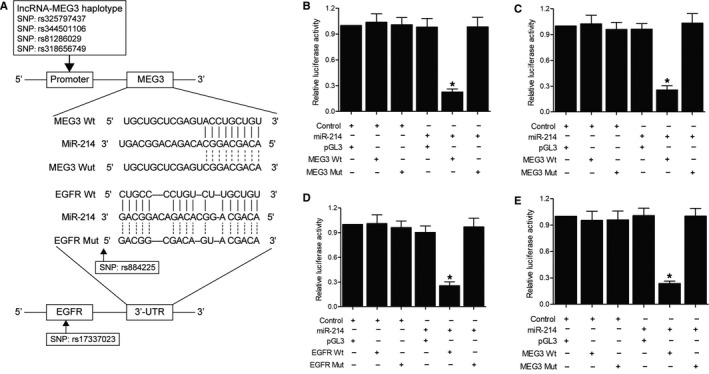
Sequence analysis and luciferase assay analysis upon the interaction between MEG3 and miR‐214, as well as the interaction between EGFR and miR‐214 (*P value < .05, vs. control groups). A, Schematics describing the potential roles of MEG3 haplotype, rs17337023 SNP and rs884225 SNP in the expression of EGFR and miR‐214. B, Only the luciferase activity in A549 cells cotransfected with wild‐type MEG3 and miR‐214 was significantly reduced compared with other cell groups. C, Only the luciferase activity in H460 cells cotransfected with wild‐type MEG3 and miR‐214 was significantly reduced compared with other cell groups. D, Only the luciferase activity in A549 cells cotransfected with wild‐type EGFR 3' UTR and miR‐214 was significantly reduced compared with other cell groups. E, Only the luciferase activity in H460 cells cotransfected with wild‐type EGFR 3' UTR and miR‐214 was significantly reduced compared with other cell groups