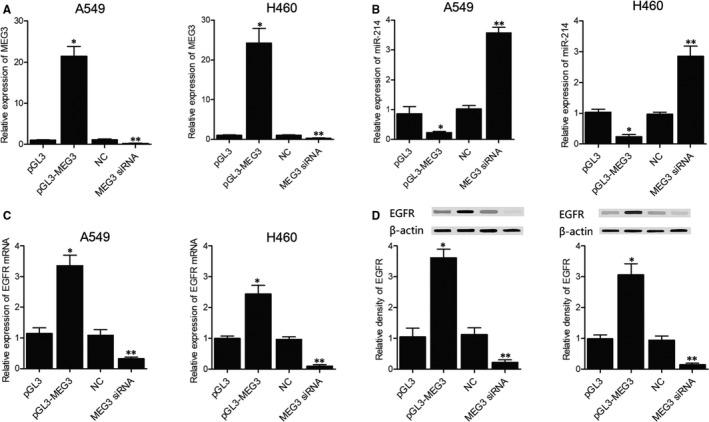
FIGURE 4.

The expression of MEG3, miR‐214, EGFR mRNA and protein in the different A549 and H460 cell groups transfected with pGL3‐MEG3 or MEG3 siRNA in comparison with pGL3 or NC siRNA (*P value < .05, vs. pGL3 group; **P value < .05, vs NC group). A, The expression of MEG3 in different groups was measured by real‐time PCR. B, The expression of miR‐214 in different groups was measured by real‐time PCR. C, The expression of EGFR mRNA in different groups was measured by real‐time PCR. D, The expression of EGFR proteins in different groups was measured by Western blot
