
FIGURE 3.
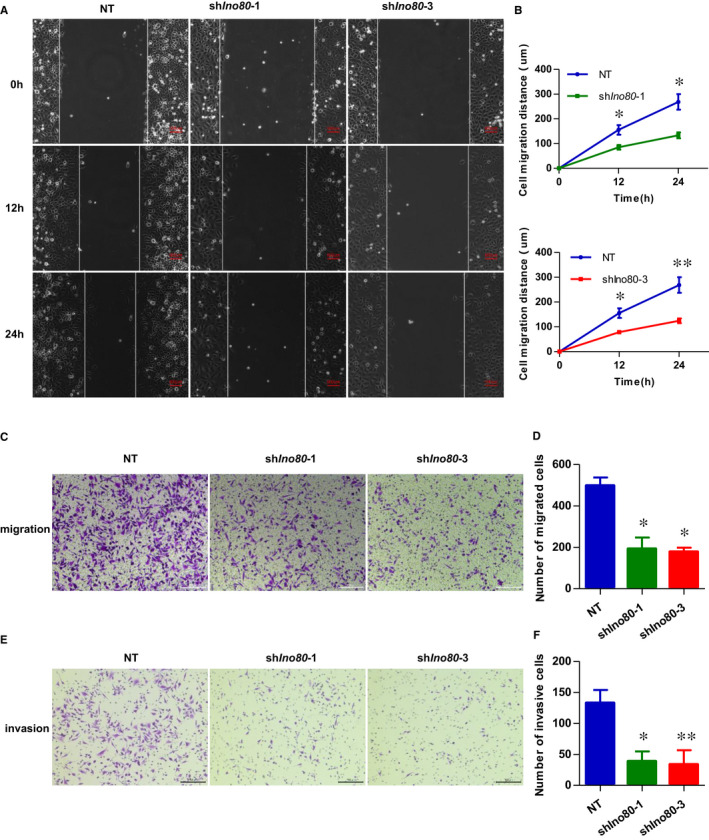
Ino80 was required for trophoblast migration and invasion. (A) Representative images to show scratch‐wound assay. Confluent HTR8/SVneo monolayers were transfected with either shIno80‐1, shIno80‐3 or shNT and subjected to scratch‐wound assay 3 d after infection. Images were taken 0, 12 and 24 h after assay (white lines indicate wound edge). Scale bar = 100 μm. (B) Quantitative analysis of migration distance. The mean distance was calculated from average of 6 microscope fields from 3 independent experiments. Values were plotted as mean ± SEM. P value was calculated by Student's t test. *P < 0.05, **P < 0.01. (C) Representative images to show HTR8/SVneo cells migration in transwell chambers. HTR8/SVneo cells were transfected with either shIno80‐1, shIno80‐3 or shNT, respectively. Scale bar = 200 μm. (D) Quantitative analysis of the number of migrated cells. Migrated cells were quantified by the average of 5 randomly selected regions per experiment, and from 3 independent experiments. Values were plotted as mean ± SEM. P value was calculated by Student's t test. *P < .05. (E) Representative images to show HTR8/SVneo cells invasion in transwell chambers, which were pre‐coated with extracellular matrix proteins. The HTR8/SVneo cells were transfected with either shIno80‐1, shIno80‐3 or shNT, respectively. Scale bar = 200 μm. (F) Quantitative analysis of the number of invasion cells. Invaded cells were quantified by the average of 5 randomly selected regions per experiment, and from 3 independent experiments. Values were plotted as mean ± SEM. P value was calculated by Student's t test. *P < 0.05, **P < 0.01