
FIGURE 4.
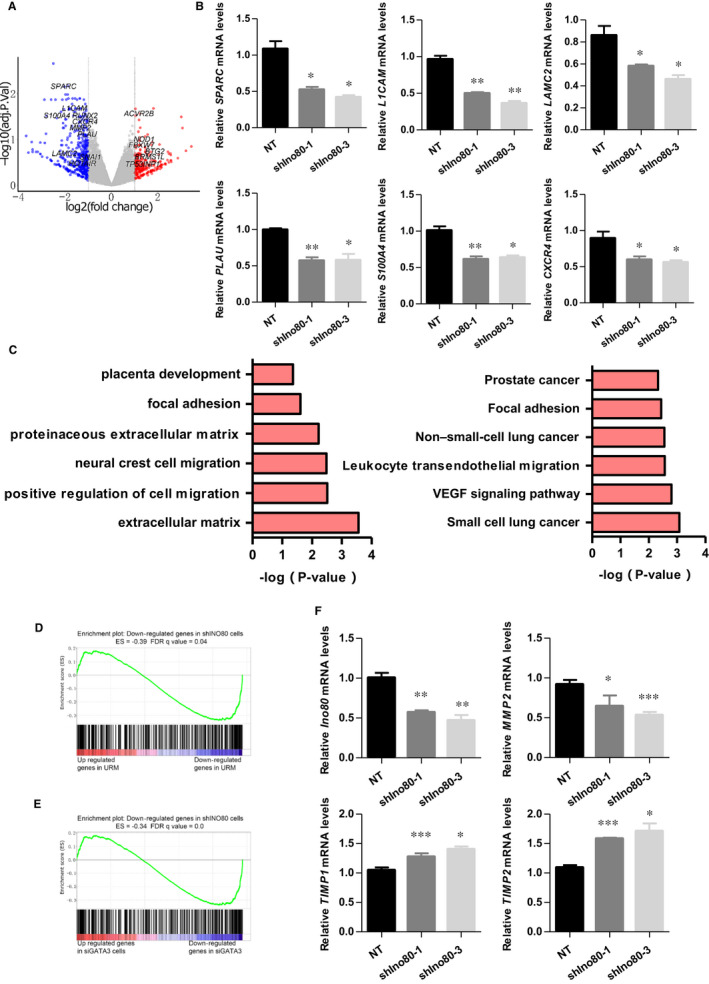
Ino80 regulated the expression of invasion‐related genes. (A) Volcano plot to show gene expression changes on Ino80 silencing in HTR8/SVneo cells. Cells were collected 3 d after Ino80 silencing and total RNA was prepared for RNA‐Seq. (B) Expressions of SPARC, L1CAM, LAMC2, PLAU, S100A4 and CXCR4 were determined by real‐time PCR in HTR8/SVneo cells transfected with either shIno80‐1, shIno80‐3 or shNT, respectively. Values were plotted as mean ± SEM from 3 independent experiments. P value was calculated by Student's t test. *P < 0.05, **P < 0.01. (C) Gene ontology analysis and KEGG analysis of genes down‐regulated on Ino80 depletion. Selected 6 categories are shown. (D) Gene set enrichment analysis (GSEA) showing that Ino80 silencing repressed genes were enriched for genes that were low expressed in villus tissues of URM. (E) GSEA showing that Ino80 silencing‐repressed genes were enriched for genes that were low expressed in trophoblasts after GATA3 knock‐down. (F) Expressions of Ino80, MMP2, TIMP1 and TIMP2 were determined by real‐time PCR in HTR8/SVneo cells transfected with either shIno80‐1, shIno80‐3 or shNT, respectively. Values were plotted as mean ± SEM from 3 independent experiments. P value was calculated by Student's t test. *P < 0.05, **P < 0.01, ***P < 0.001