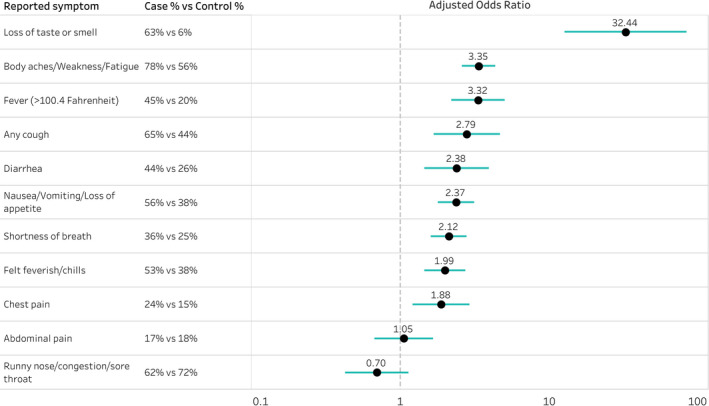
FIGURE 1.

Adjusteda odds ratios comparing odds of reported symptoms among COVID‐19 casesb compared with controlsc, July 2020. aAdjusted for race/ethnicity, sex, age, and presence of ≥1 underlying chronic medical condition (at least one of the following underlying chronic medical conditions: cardiac condition, hypertension, asthma, chronic obstructive pulmonary disease (COPD), immunodeficiency, psychiatric condition, diabetes, or obesity). bA COVID‐19 case was laboratory‐confirmed for SARS‐CoV‐2 by reverse transcriptase polymerase chain reaction (RT‐PCR). cControl participants tested negative for SARS‐CoV‐2 infection by RT‐PCR at the same health facilities. Potentially eligible patients were randomly selected in a ratio of 2 controls for each case patient from lists of adults who were tested at outpatient clinics associated with 11 academic medical centers participating in the Influenza Vaccine Effectiveness in the Critically Ill (IVY) Network
