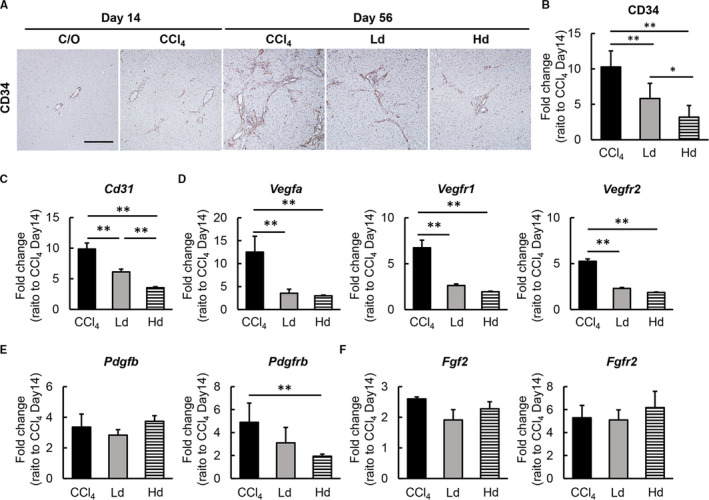
FIGURE 5.

Effects of lenvatinib on intrahepatic capillarization and angiogenesis in CCl4‐induced fibrotic liver. A, Representative microphotographs of CD34 staining in the experimental groups. Scale bar; 50 μm. B, Semi‐quantitation of CD34‐positive vessels in the experimental groups in high‐power field (HPF) by ImageJ software. Quantitative analysis included five fields per section. (C‐F) Relative mRNA expression of (C) Cd31, (D) Vegfa, Vegfr1 and Vefgr2, (E) Pdgfb and Pdgfrb, (F) Fgf2 and Fgfr in the experimental groups. The mRNA expression levels were measured by qRT‐PCR, and Gapdh was used as internal control. C/O, Corn oil‐administered group; CCl4, CCl4 with vehicle‐administered group; Ld; CCl4 with low dose of lenvatinib‐administered group, Hd; CCl4 with high dose of lenvatinib‐administered group. Data are mean ± SD (n = 10). Quantitative values are relatively indicated as fold changes to the values of CCl4 at day 14 (B‐F). *P < 0.05; **P < 0.01, indicating a significant difference between groups (B‐F)
